
MOVE/VIX Ratio - Weekly Z-Score
Shows how far the ratio of bond-market to stock-market expected volatility (MOVE/VIX) sits from its own weekly average, measured as a z-score.
Open on TradingView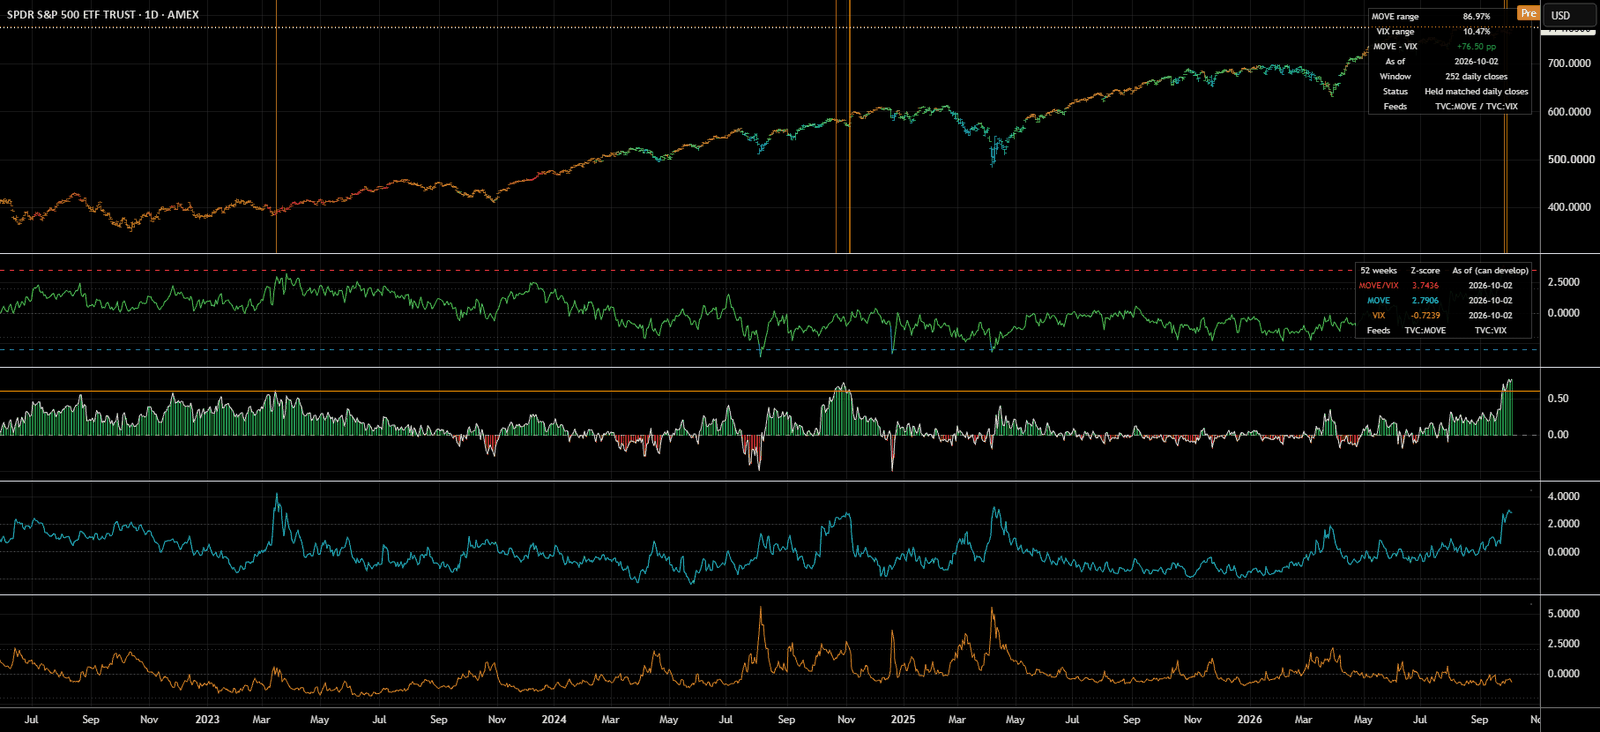
What it shows
MOVE is an index of expected volatility in US Treasury bonds. VIX is an index of expected volatility in the S&P 500, the main index of large US stocks. Dividing MOVE by VIX gives one number that compares how nervous the bond market is with how nervous the stock market is.
This indicator compares that ratio with its own weekly history and shows the result as a z-score: how far the latest value is from its own average, counted in standard deviations. A standard deviation is the typical size of a move away from the average. A z-score of 0 means the ratio is at its average; +2 means it is two standard deviations above it.
It reads the MOVE and VIX index feeds directly, so the reading is the same whatever symbol your chart shows.
How it is calculated
- Z-score = (latest value minus the weekly average) divided by the population standard deviation.
- The window holds 52 weekly readings: the last 51 completed weekly closes plus the latest daily reading of the current week.
- Changing your chart symbol does not change the index feeds or the window.
- In the settings (Inputs) you can show the ratio, MOVE on its own, VIX on its own, or MOVE and VIX together.
- The z-scores of MOVE and VIX on their own describe each index separately. They do not add up to the z-score of the ratio.
Data used: TVC:MOVE, TVC:VIX.
How to read it
- In the Ratio panel, the line and the table reading are red above +3.5, blue below -3 and green otherwise. A value exactly at either level stays green.
- Dashed red and blue lines mark the +3.5 and -3 levels.
- The optional colouring of the price bars (a heatmap) uses its own colour scale, separate from these two levels.
- The table shows the source date of each reading. Check it, because the current day and week are still developing.
- A z-score describes where the ratio is now compared with its own past. It is not a forecast.
Good to know
- Daily and weekly charts are the intended views.
- The readings for the current day and week can still change. A chart of a market that closes earlier than the indices can show the previous index session.
- On intraday charts the history is sampled once a day and can change after you reload the chart.
- TradingView’s Bar Replay is not supported, because the indicator reads MOVE/VIX as a spread symbol, which Bar Replay does not handle.
- If history is missing, or the standard deviation is zero, the indicator shows no reading.
How to add it to your chart
- Open the indicator’s page on TradingView and sign in to your TradingView account.
- Select “Use on chart” to open it on a chart, or “Add to favorites” to keep it in your list.
- On any chart, open Indicators and find it under Favorites, or search for its name. Change its settings in the indicator’s Inputs.
This indicator is a research tool. It is not investment advice or a trading signal.