
MOVE vs VIX - 1-Year Range Position
Puts MOVE (bond volatility) and VIX (stock volatility) on the same 0 to 100 scale within their own one-year ranges, then shows the gap between the two.
Open on TradingView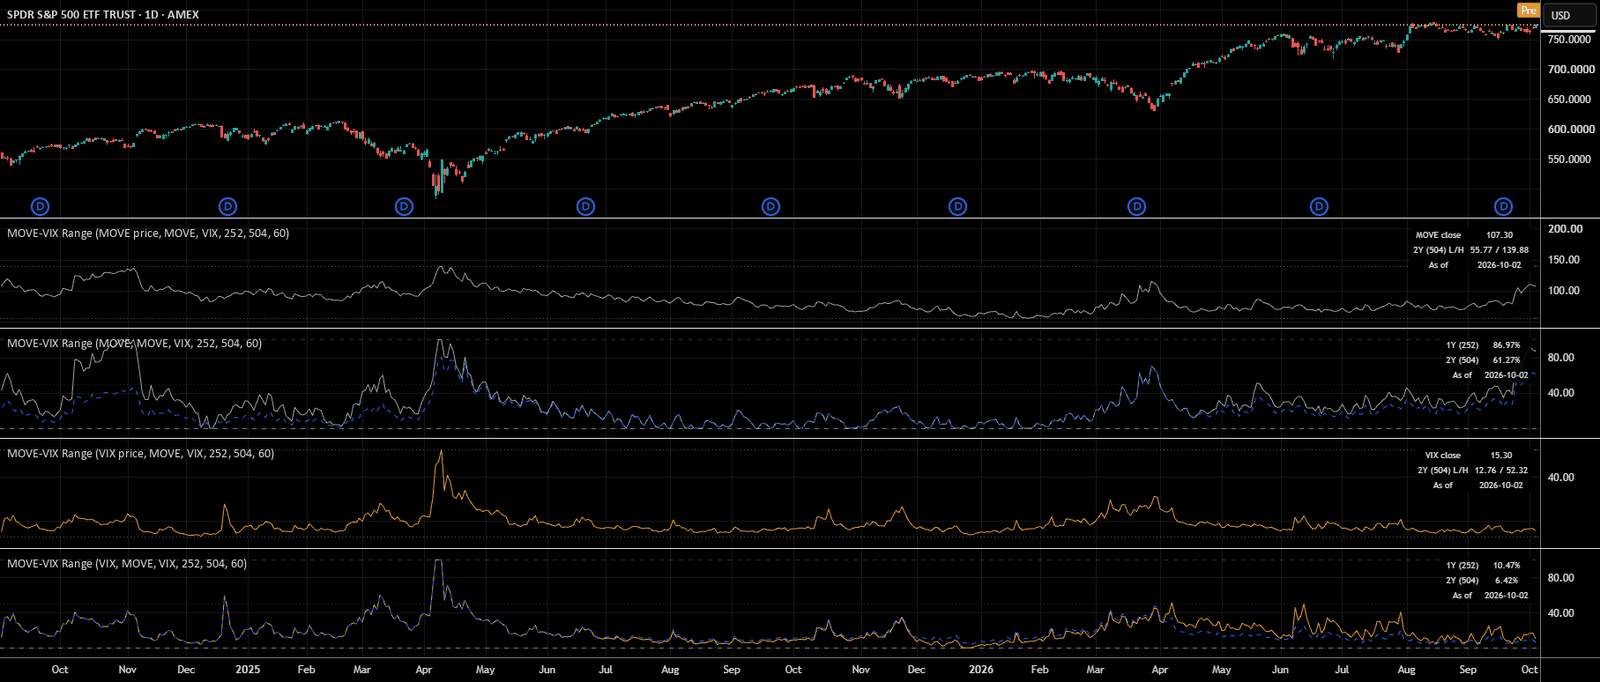
What it shows
MOVE is an index of expected volatility in US Treasury bonds. VIX is an index of expected volatility in the S&P 500, the main index of large US stocks. The two use different scales, so subtracting one raw number from the other is not a like-for-like comparison.
This indicator first puts each index on the same scale: where its latest daily close sits within its own range over about the past year, from 0 (the lowest close in that time) to 100 (the highest). It then subtracts the VIX position from the MOVE position.
A positive difference means bond-market volatility is higher within its own range than stock-market volatility is within its range. A negative difference means the reverse.
How it is calculated
- Range position = 100 × (latest daily close minus the lowest close in the window) ÷ (highest close in the window minus the lowest close).
- The default window is 252 daily closes, about one trading year: the day being measured plus the 251 sessions before it.
- The range uses daily closing values, not the highs and lows during the day.
- Difference = MOVE range position minus VIX range position, in percentage points. For example, MOVE at 87% and VIX at 10% gives a difference of +77 percentage points.
Data used: TVC:MOVE, TVC:VIX.
How to read it
- This is a range position, not a percentile rank. A reading of 87% means the close is 87% of the way from the lowest close to the highest close. It does not mean the value is higher than 87% of past readings, which is what a percentile rank would tell you.
- Green columns show a positive difference; red columns show a negative difference.
- An orange line marks +60 percentage points by default (shown as 0.60 on the default 0 to 1 scale). Orange marks on the price chart show where the difference crossed above it.
- The table shows the readings in percent and percentage points, and the date of the latest matched pair of closes (“As of”).
- Use a standard daily (1D) chart of TVC:MOVE. For the three-panel layout, add the indicator three times and set Panel to MOVE, VIX and Difference, keeping the symbols and window the same on each.
- An update on 6 October 2026 added weekly and monthly charts, which show the latest matched daily pair for each week or month. Daily or weekly views are recommended for a current comparison.
Good to know
- The threshold is a visual reference, not a calibrated trading signal.
- It describes where each index sits within its past range. It does not predict that one index will catch up with the other, and it contains no trade execution or tested trading strategy.
- Both indices must have a close on the same trading date. Missing values are not filled in, and an incomplete window or a flat range (highest close equal to lowest) gives no value. Check the “As of” date in the table.
- Data feeds can be delayed or revised, and a newly closed session may need a chart reload to appear.
- On weekly or monthly charts, crossings of the threshold that happened between samples can be missed; the daily chart shows all of them.
The script’s source code is published under the Mozilla Public License 2.0.
How to add it to your chart
- Open the indicator’s page on TradingView and sign in to your TradingView account.
- Select “Use on chart” to open it on a chart, or “Add to favorites” to keep it in your list.
- On any chart, open Indicators and find it under Favorites, or search for its name. Change its settings in the indicator’s Inputs.
This indicator is a research tool. It is not investment advice or a trading signal.