
DVOL/(UVOL+DVOL) 5min INTRADAY
Marks 5-minute bars where volume in falling US stocks is at least 89.9% of all volume, or at most 9.9%: extreme one-sided selling or buying.
Open on TradingView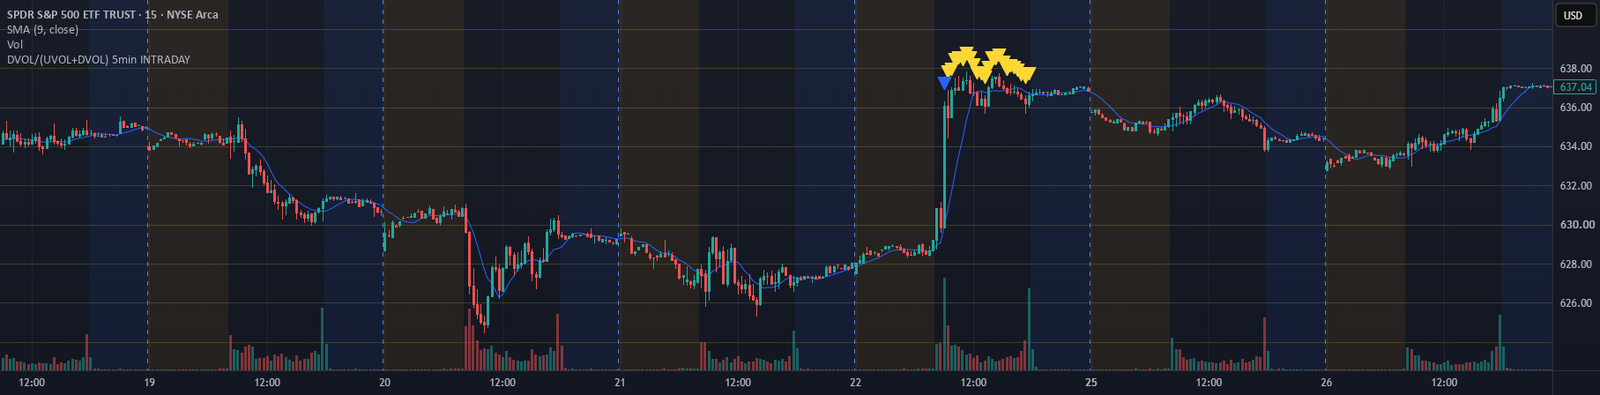
What it shows
Breadth measures how much of the market takes part in a move. UVOL is the volume traded in US stocks that are rising; DVOL is the volume traded in US stocks that are falling.
This indicator divides down volume by total volume, DVOL ÷ (UVOL + DVOL), on every 5-minute bar. It marks the moments when almost all US volume is on one side: heavy, market-wide selling or heavy, market-wide buying. It is built to spot these extremes during the trading day.
It is designed for intraday charts of SPY (the SPDR S&P 500 ETF), S&P 500 indices and S&P 500 futures.
How it is calculated
- Down volume ratio = DVOL ÷ (UVOL + DVOL), from 5-minute USI:DVOL and USI:UVOL data, whatever the timeframe of your chart.
- Extreme selling: down volume is 89.9% or more of the total.
- Extreme buying: down volume is 9.9% or less of the total, so up volume is about 90% or more.
- A repeat: the same extreme has already appeared 2 or more times over the past 3 days, today included.
- A reading counts only on a confirmed (closed) 5-minute bar and, by default, only during regular US trading hours, 09:30 to 16:00 New York time.
- Volume data from the previous day is ignored, so the previous day’s last bar cannot trigger a reading at today’s open.
Data used: USI:UVOL, USI:DVOL.
How to read it
- Orange triangle below the bar: the first extreme-selling reading.
- Purple triangle below the bar: repeated extreme selling (clustered selling pressure).
- Blue triangle above the bar: the first extreme-buying reading.
- Yellow triangle above the bar: repeated extreme buying (clustered buying pressure).
- Each reading can also fire a TradingView alert with a ready-made message in JSON format, once per bar. The alert can be sent to a webhook, a web address that receives the message automatically.
Good to know
- It is meant for intraday charts and intraday use only.
- By default it ignores bars outside regular US trading hours; you can turn this off in the settings.
- If total volume is zero, or the volume data is not from the current day, it shows no reading.
How to add it to your chart
- Open the indicator’s page on TradingView and sign in to your TradingView account.
- Select “Use on chart” to open it on a chart, or “Add to favorites” to keep it in your list.
- On any chart, open Indicators and find it under Favorites, or search for its name. Change its settings in the indicator’s Inputs.
This indicator is a research tool. It is not investment advice or a trading signal.