
Do not put your FOMO t-shirt on
First published in Heard on the Trading Floor
Written in February 2023. Prices, yields and positions have changed since. Notices for the newsletter’s paid subscription, which has since closed, and a recommendation of another firm’s paid service are left out.
We have decided to combine the Equity and Credit market reviews in one piece.
We have done so in order to decrease the amount of e-mails you receive from us as we understand how spammy the world of Substack has gotten. Plus, we hope those of you who have been strictly focused on reading one of the reviews to accidentally find value in the other as well.
We are constantly trying to improve the way we write and lay out our thoughts in markets. Hope you like it and don’t hesitate to tell us what you think.
CREDIT MARKET REVIEW
Last week we saw moves in rates that should have taken the market down. My beloved terminal rate expectations are sitting at a new high, end of year FFR are sitting at 5% while the market priced them at 4.25% just a few weeks early at the beginning of February’23
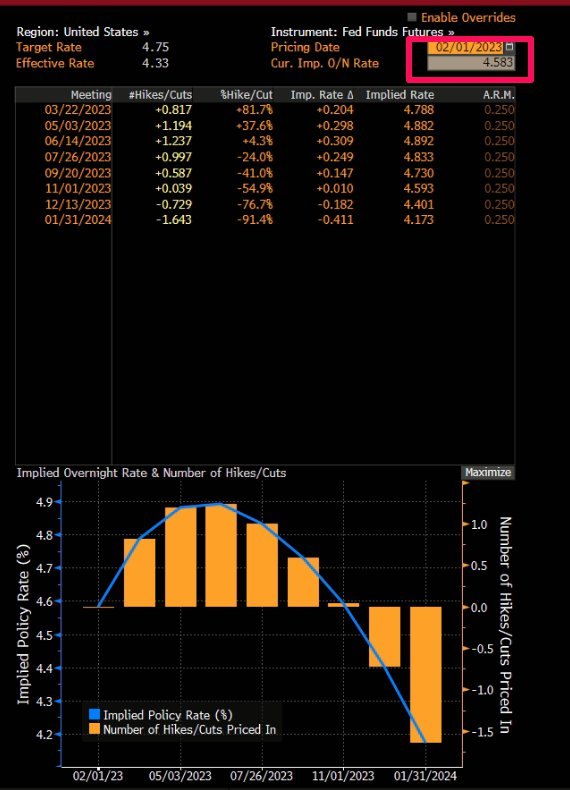
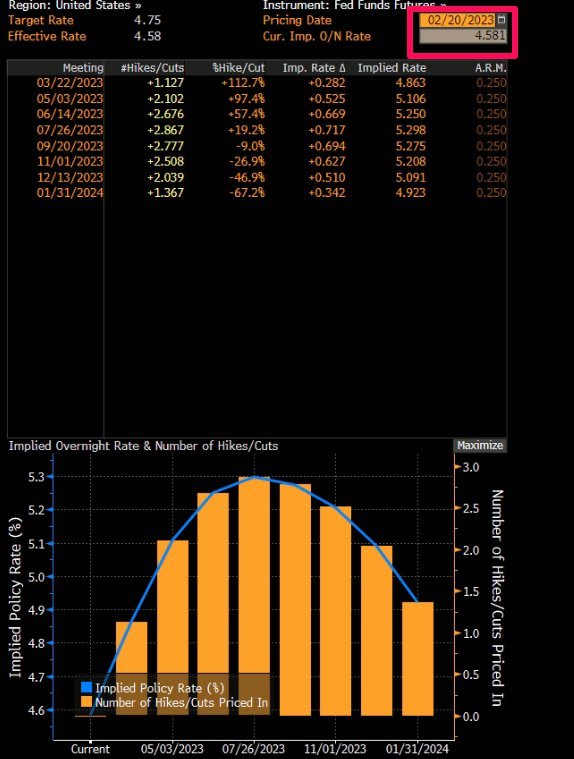
Naturally, this led to an increased appetite for new shorts. I added VIX futures , added shorts in PTY and PDI. and luckily they all worked out for now. However, I am inclined to believe that there is more waking up to be done by the market. Equities, especially tech, are still living in a La-La land where a simple wake up call could bring the equity market down (SPX) to at least 3800. Of course, there is the counter argument that equities already priced in 5%-5.25% rates and any the actual risk for equities would be only if rates exceed 6% terminal while any pullback in the terminal below 5% would be considered more bullish. This is the biggest risk bears are facing at the moment and it is a very real risk, should we not get a downside reaction in the next few days.
The CHARTS:
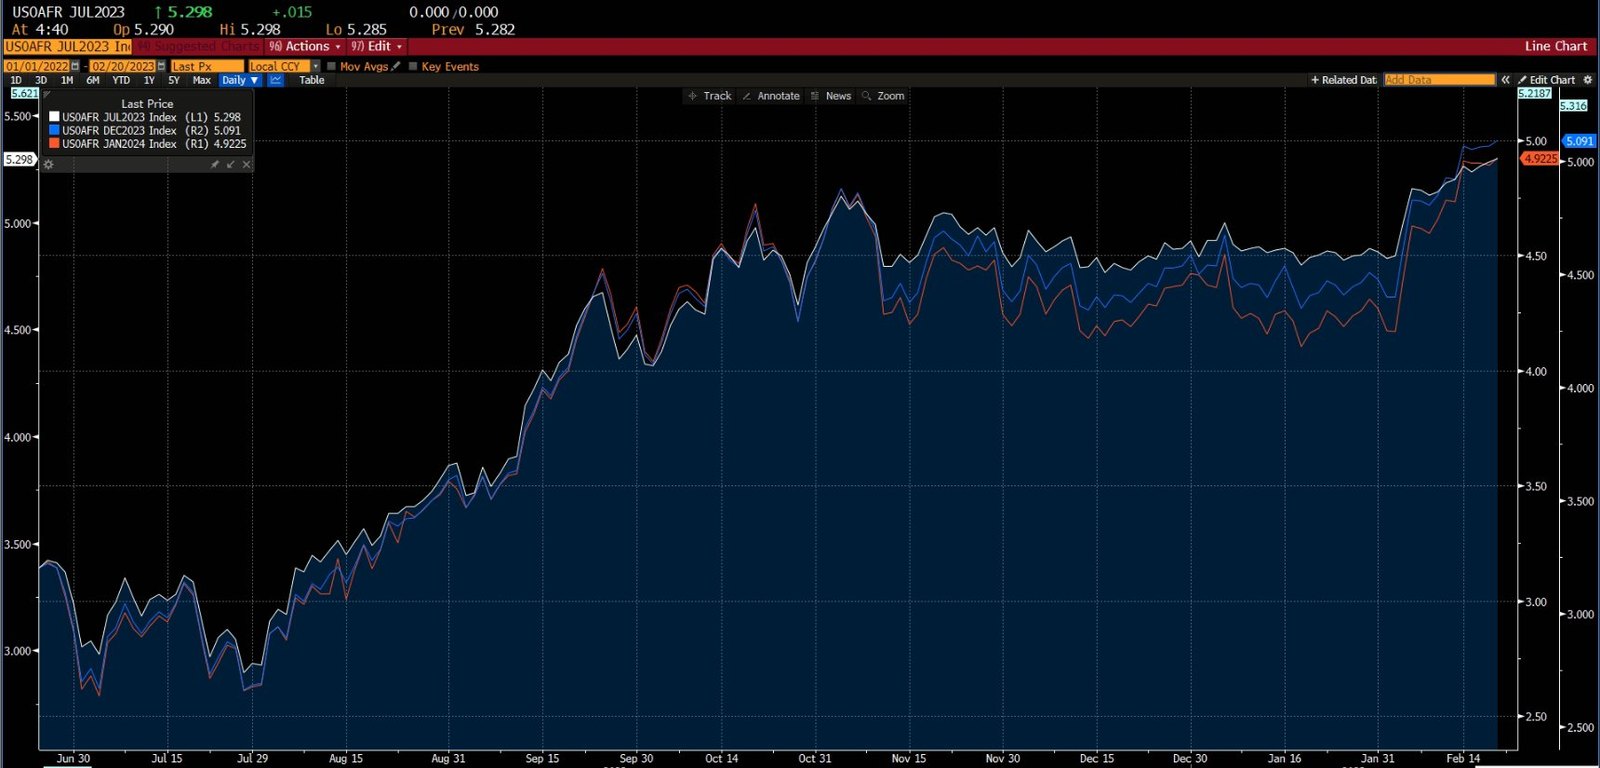
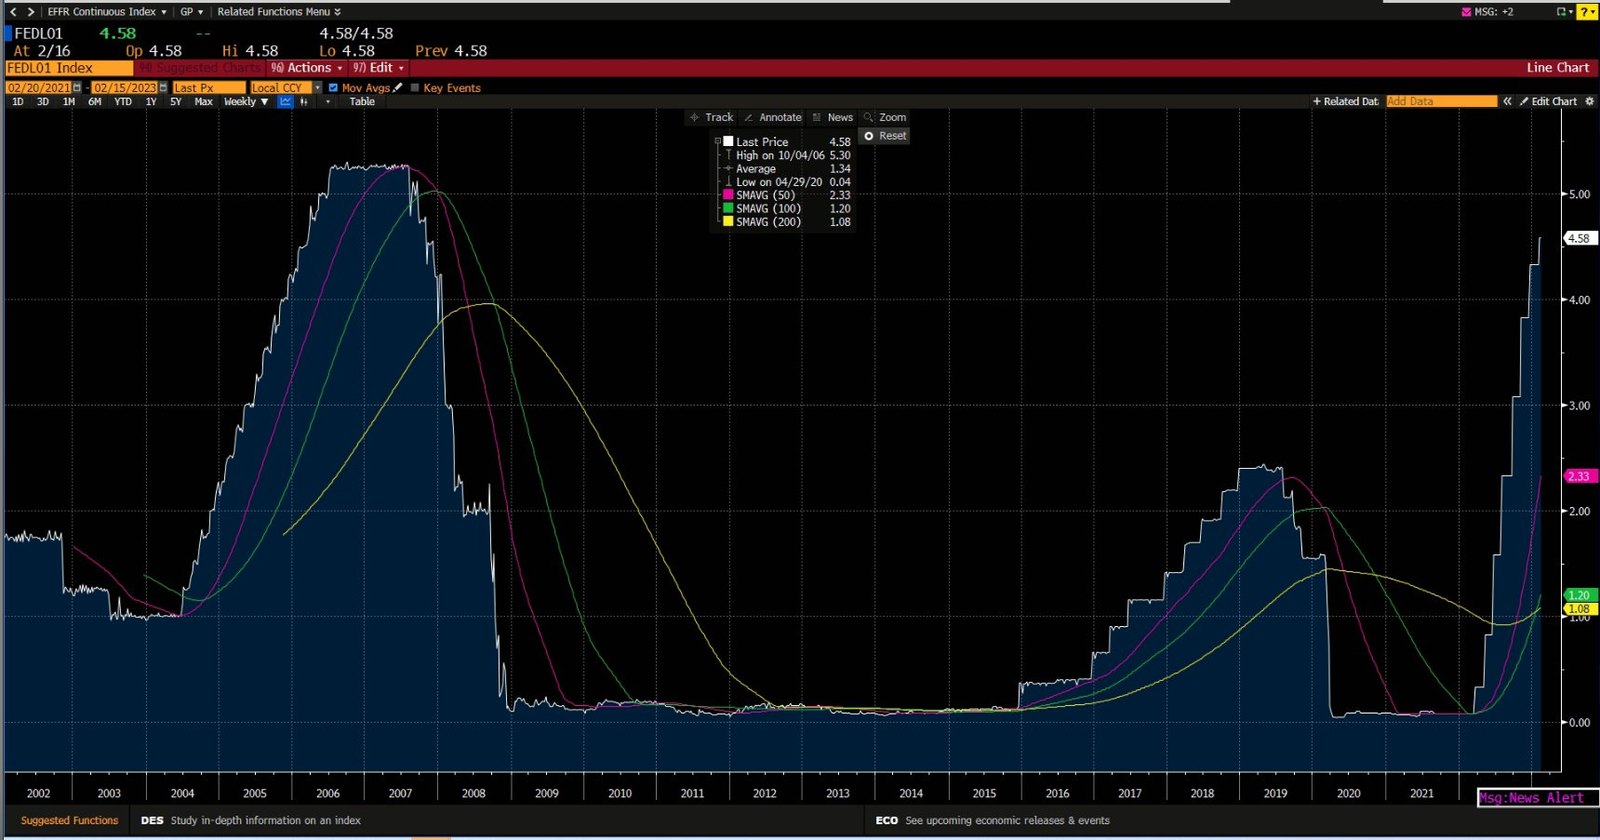
My beloved chart below displays Fed Funds Futures curve. Terminal rate now priced in the 5.25% range, exactly where the 2006 Fed Funds were, prior to the GFC.
THE ETFS
PFF:
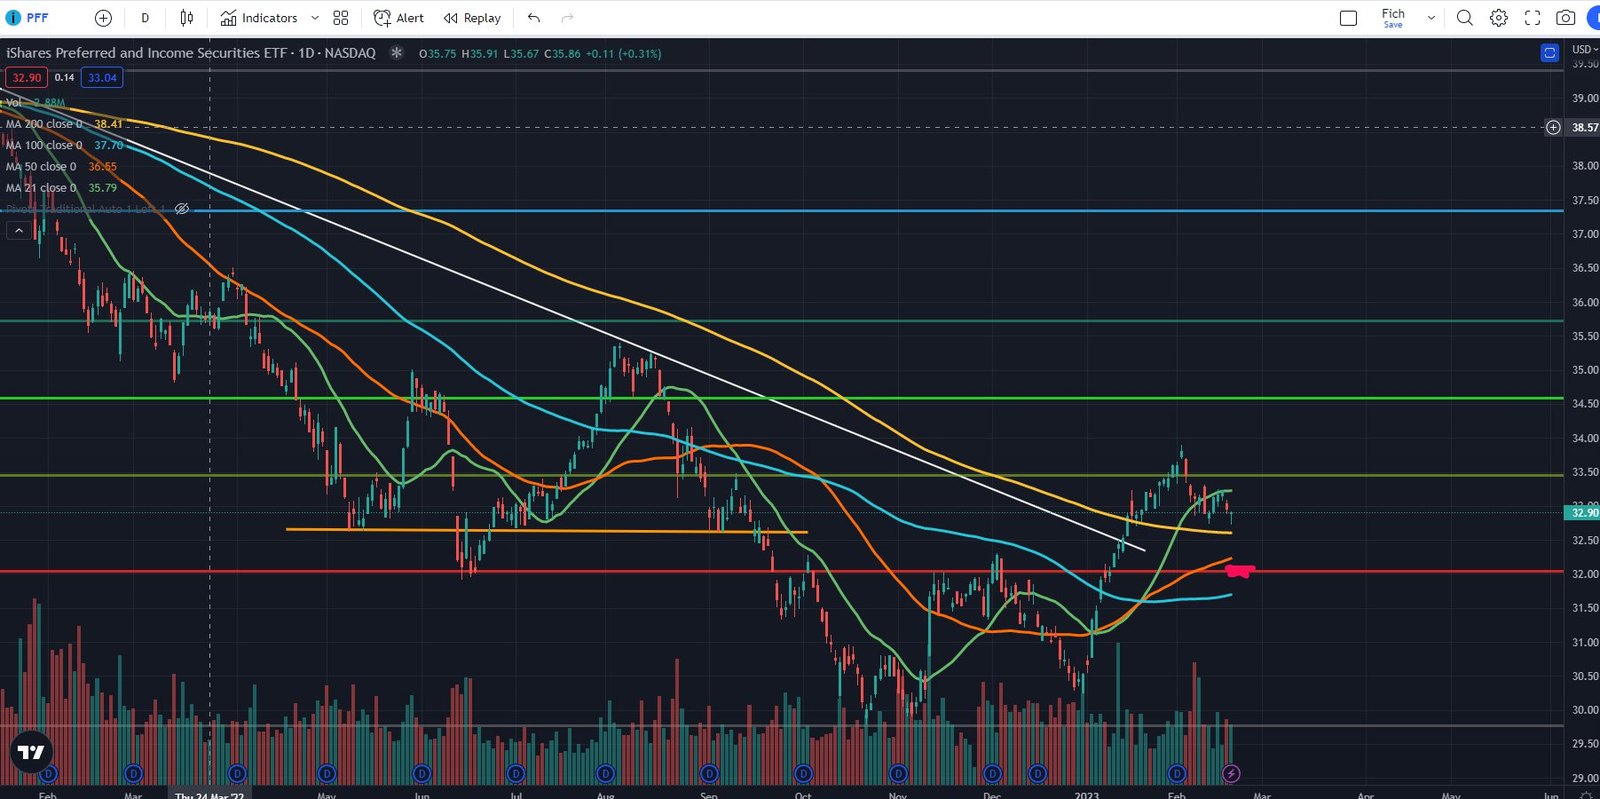
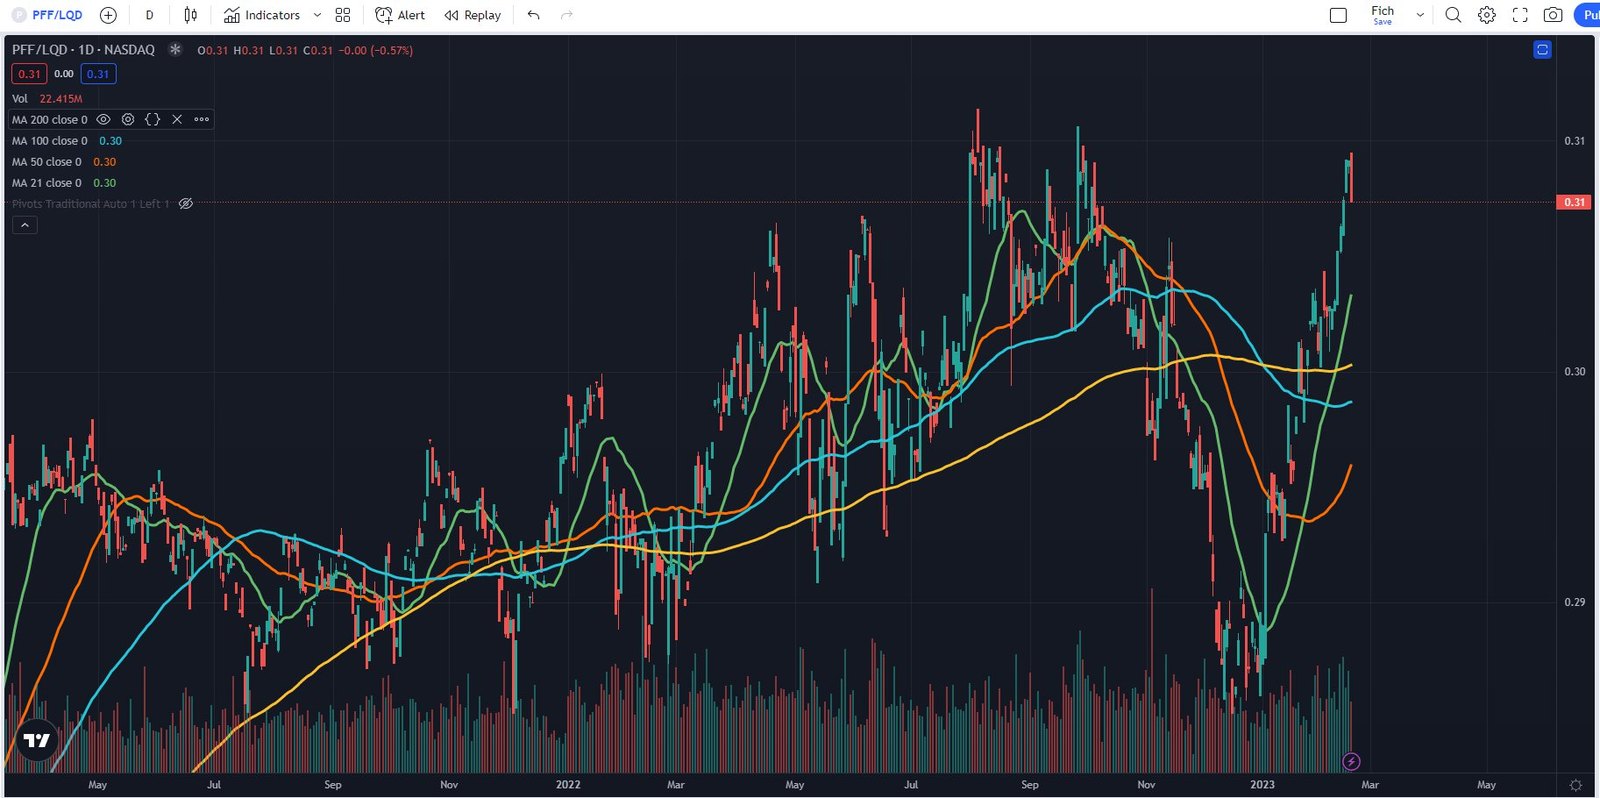
I still believe we test the $32 level and am positioned for that to happen. However I wouldn’t initiate a position at current levels but rather hold onto my existing shorts in the benchmark ETFs (PGX and PFF). As I emphasized multiple times, this year will be mostly about trading the ranges and unless we reach and test an important level, which I believe $32 is, then I wouldn’t consider exiting or reversing my positions. The name of the game will be patience. One interesting thing to note, PFF vs LQD ratio chart right at the 52 week highs. This chart tells me that PFF is set for some underperformance, at least relative to LQD.
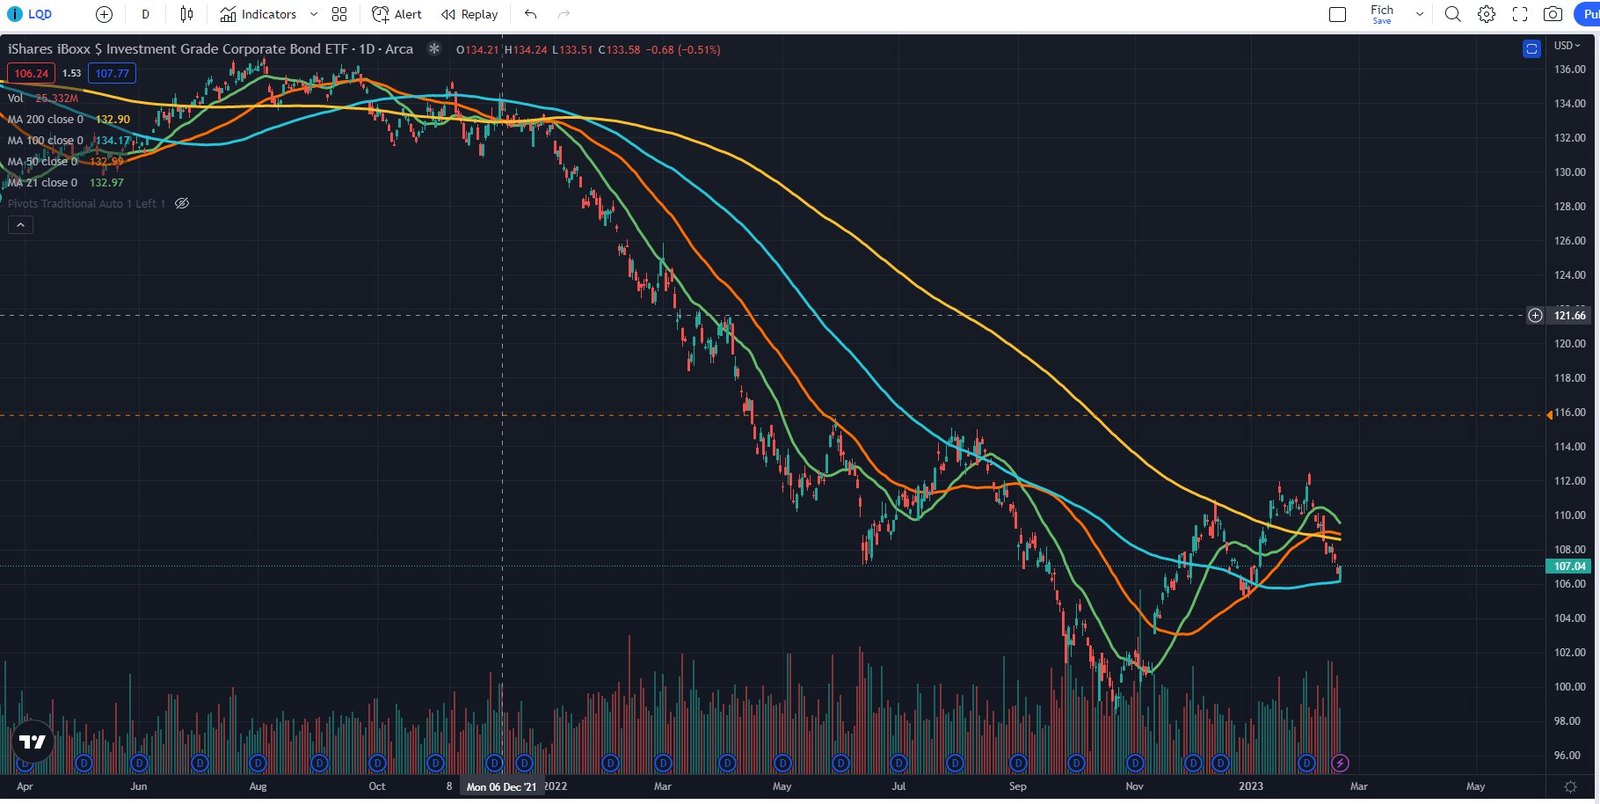
LQD - Bounced right off the 100d SMA which coincides with the Dec’22 lows but right now Investment grade bonds are trading in line with the moves in the 10 year rates. Nothing spectacular here, just the regular pullback. We need a bit more time to figure out if this level holds or fails. Tough to make that judgement on the first touch of the level in more than a month.
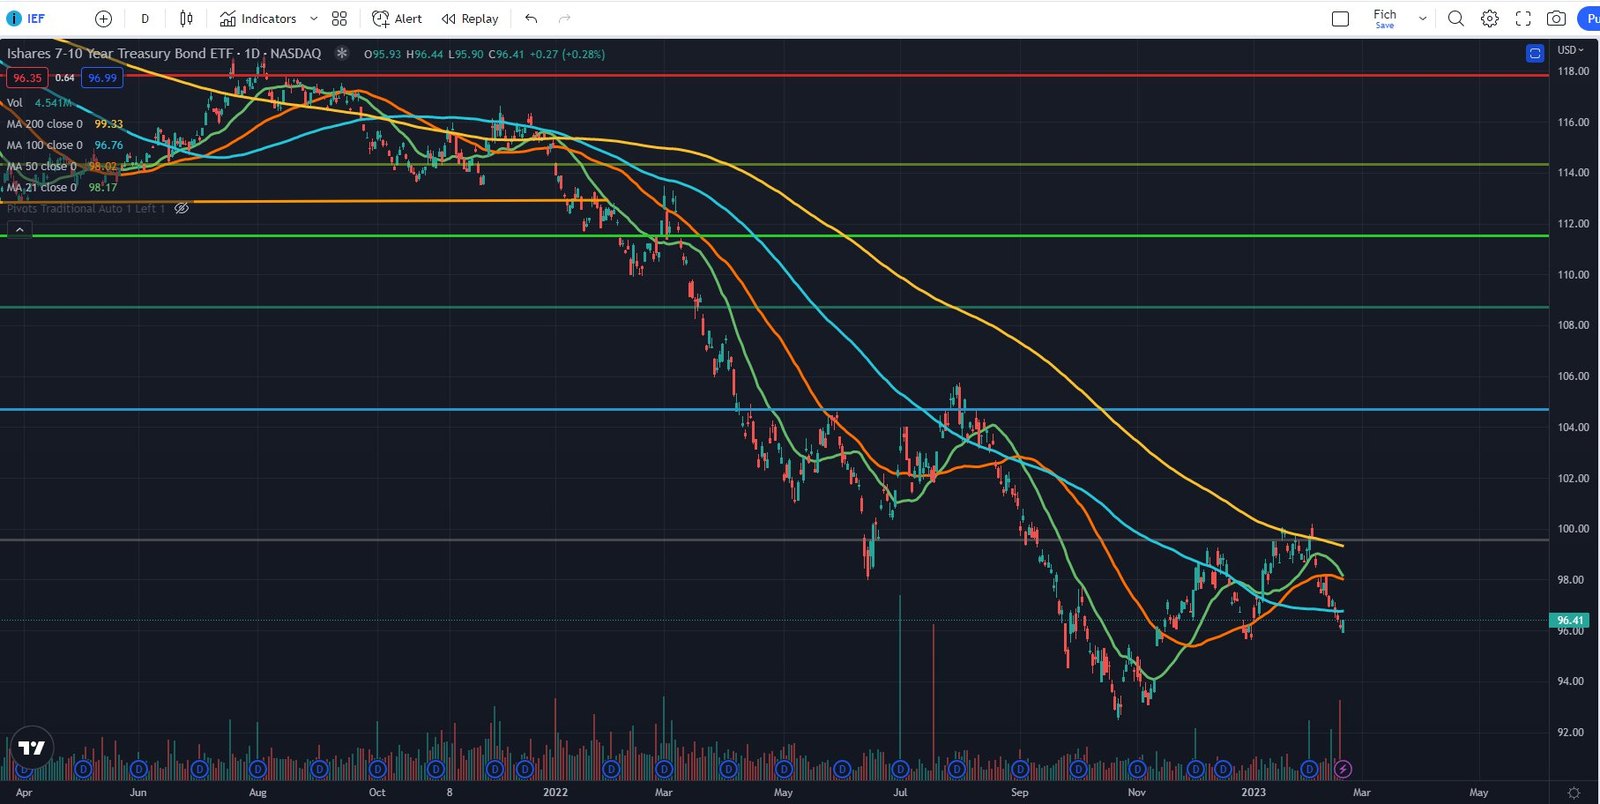
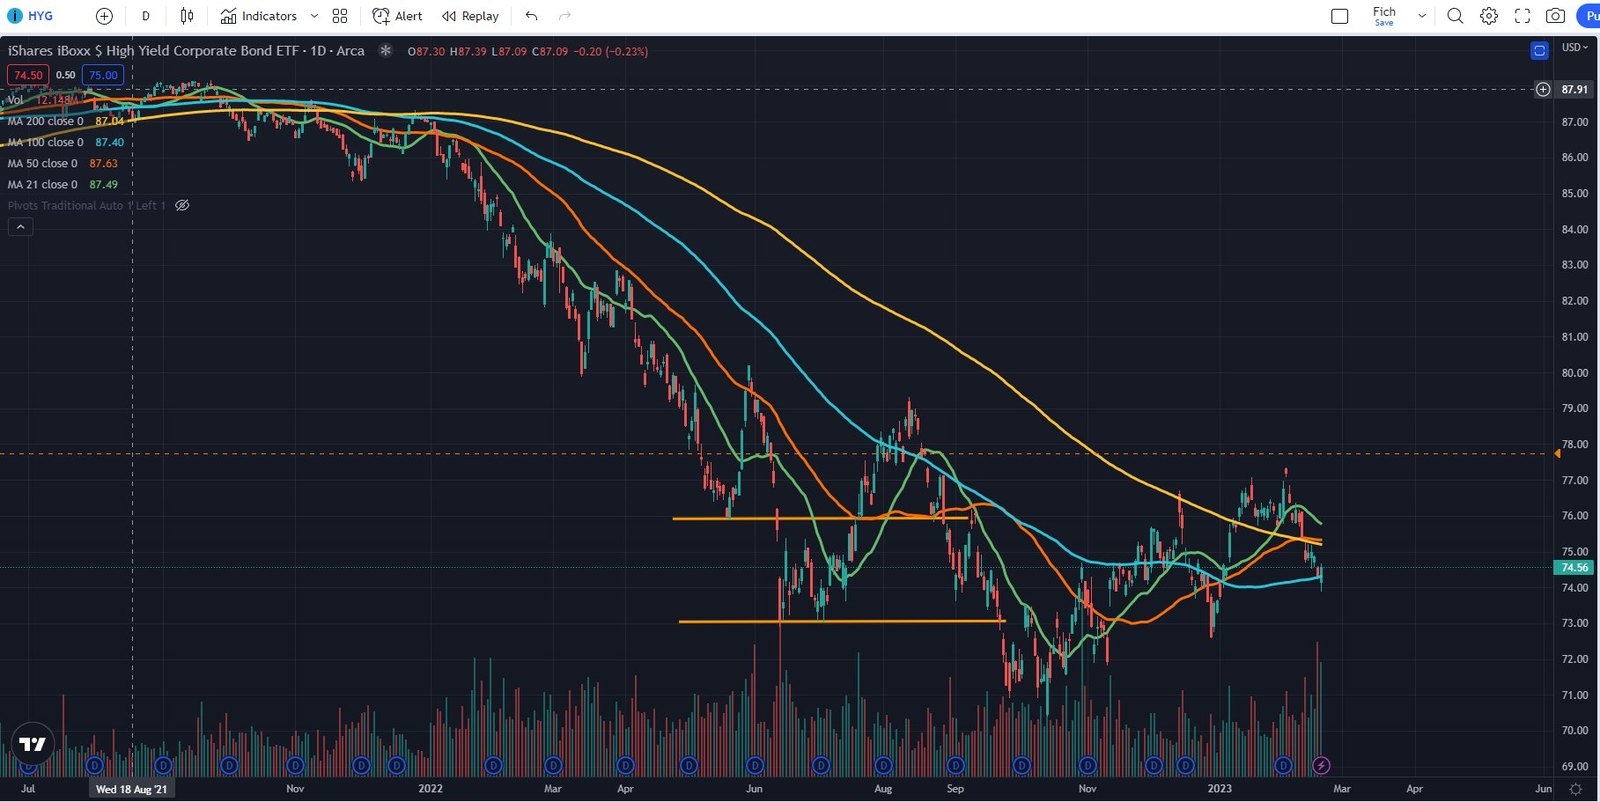
HYG - Also seems to be trading technical at the moment. Just like LQD , it bounced off the 100d SMA.
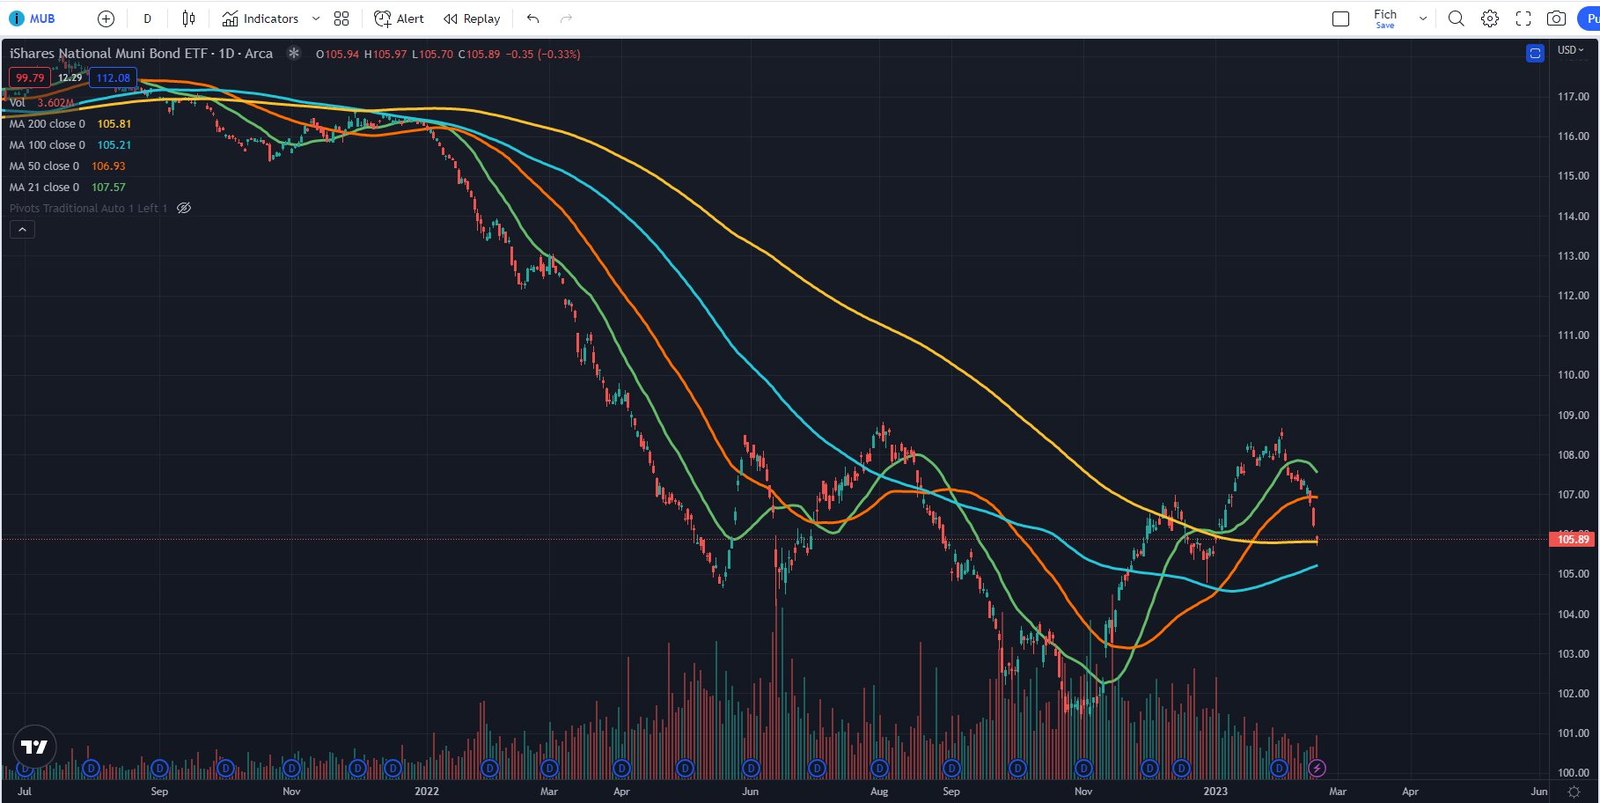
MUB - Muni ETF has the cleanest chart so far but by no means it is guaranteed to hold the 200d SMA. We can as easily go down to the 100d and trading between the 100d and 200d for a few weeks before getting a clear signal of the next move.
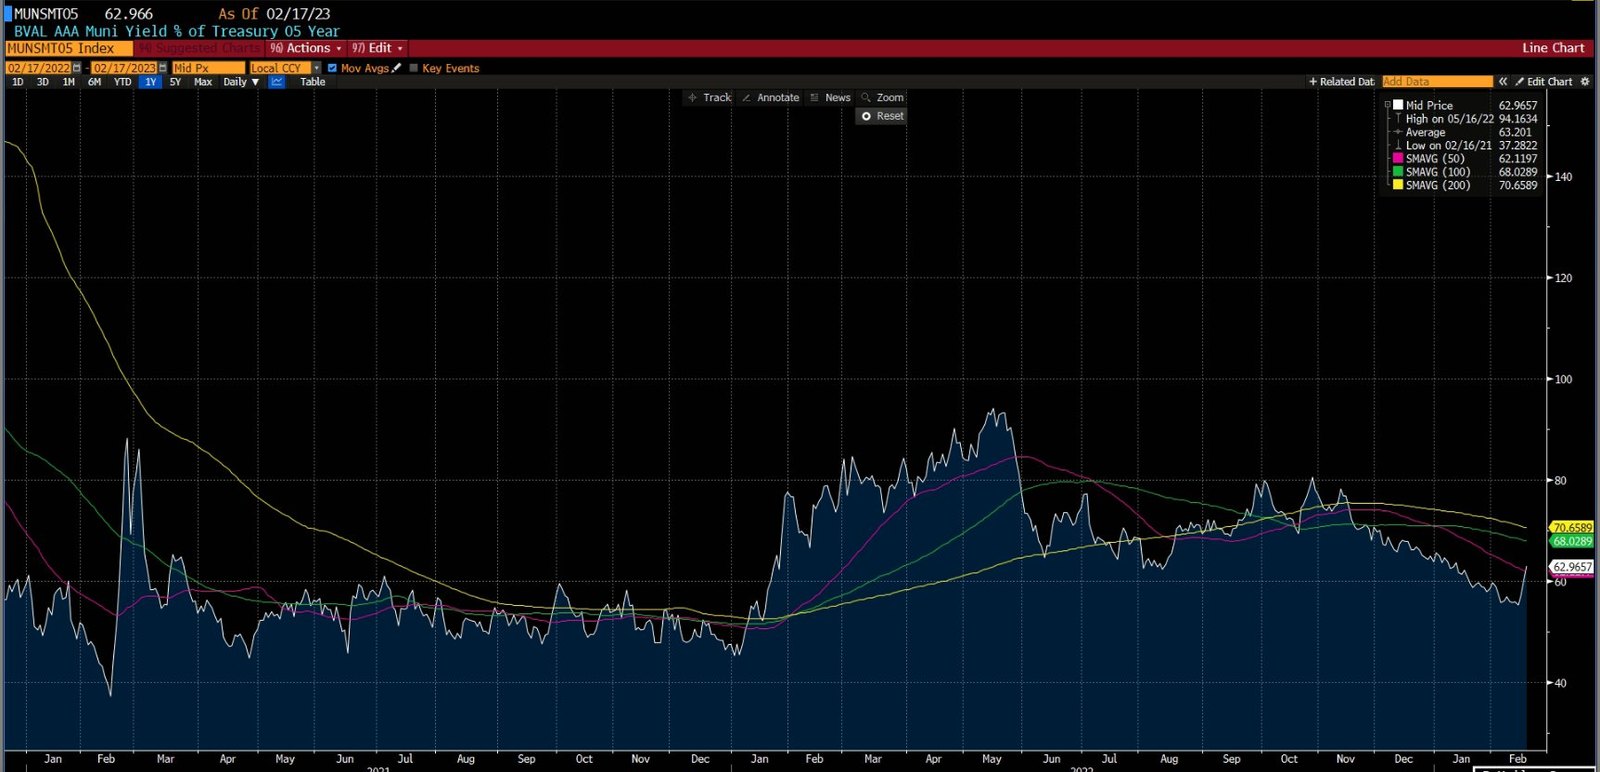
Muni credit spreads also widening, a move not seen in about 3 months.
EMB - Tagging the 200d SMA. Usually, first touches of the 200d SMAs are sticky or used as a level for a very short-term bounce. Many technical traders and algos use these levels as a starting point.
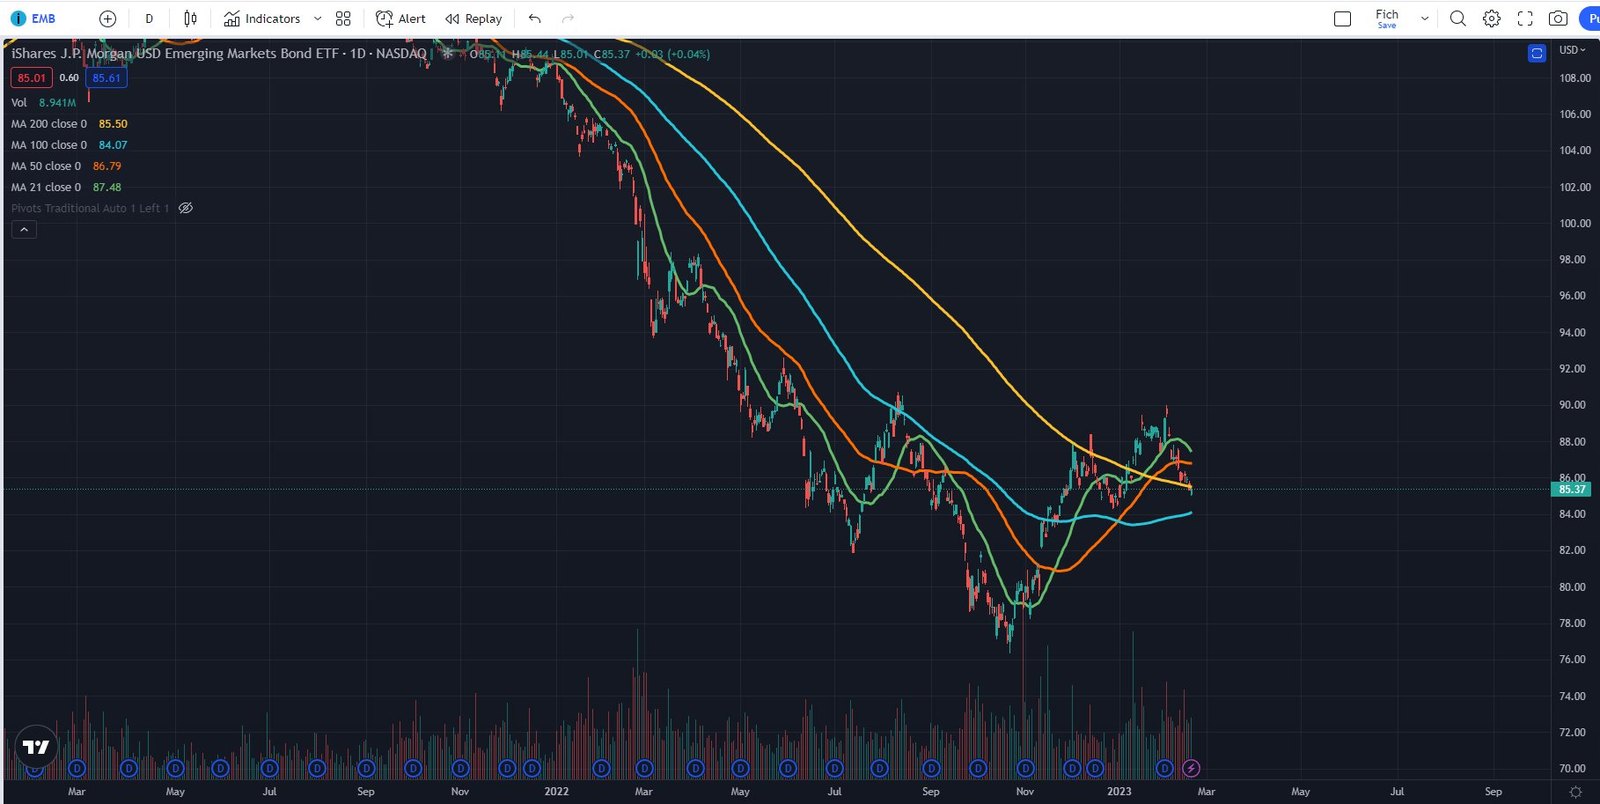
Looking through the most important charts, the technical pullback (something I’ve awaited for more than a few weeks) is stalling at the moving averages. There is no fear yet and should volatility not pick up in the next few days, the cluster of technical levels that we are currently trading at will very likely serve as a short-term trampoline level, where most assets will bounce from.
This observation, combined with the fact that terminal rates and FFR futures may likely drop in the near term, are building an uneasy feeling in me that we may actually get a bounce from current levels in the credit markets. My portfolio is short and I am personally feeling bearish but the price action and technicals are giving me reasons to doubt myself. Usually when I am in such situation I will let price action and time dictate my next move. I will consider getting flat in 2 possible scenarios:
Price wise my positions move against me and are at my stop loss level or close to that level.
Time wise nothing happens in my pre-defined time horizon. In my case I am thinking of giving it no more than 5 to 10 trading days and if nothing happens then I am getting rid of the shorts.
Potential positions:
As I am feeling in a no mans land where patience is needed (I don’t think it is time to initiate new swing positions) I have decided to go through our scanners and check out all of the perpetuals that are getting called by the end of ‘23 and their floating rates moves to 7%+.
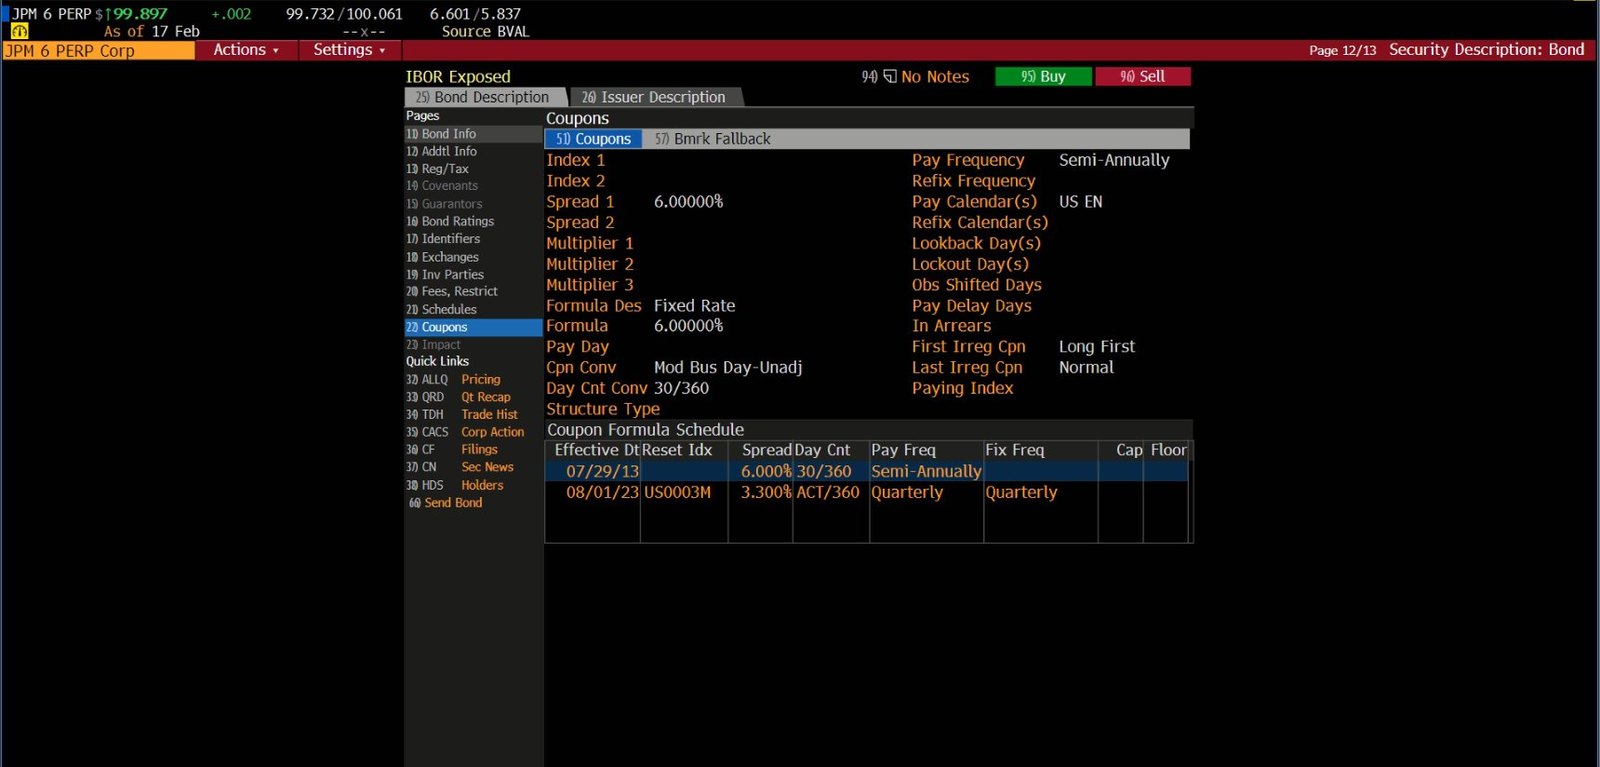
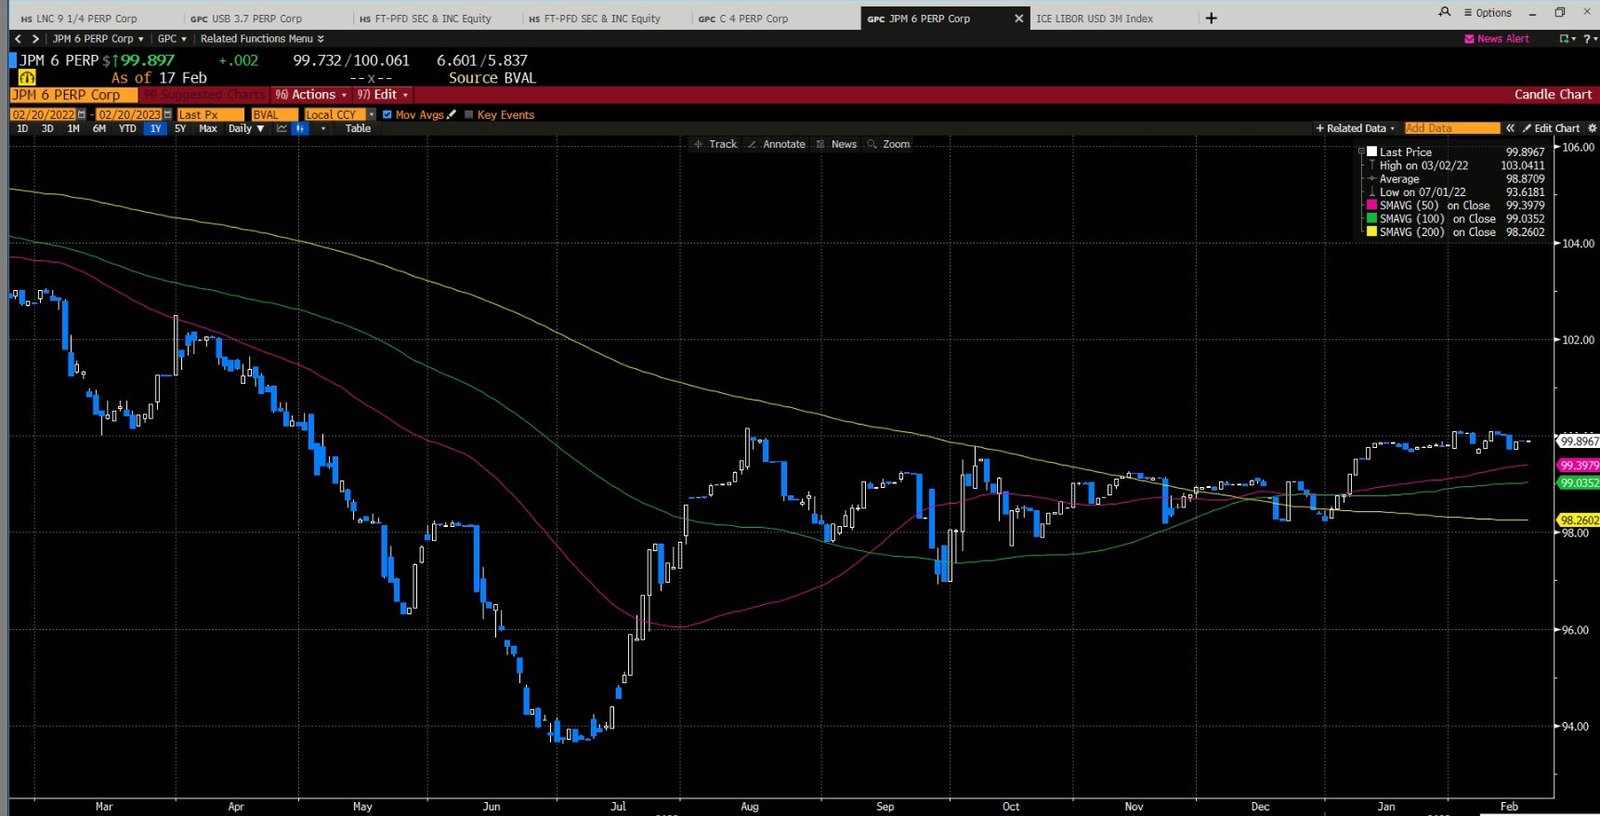
JPM 6 Perp.
Currently trading around ~100 and paying 6%. Starting the 1st of Aug’23 , turns into a floater and will pay 3 Month Libor (Currently around ~4.9%) + 3.3% or ~ 8.2%. Likely to be called at that time so the current 6% look relatively safe here. You get extra 1% return on top of the risk free rate for 6 months with the added benefit of going to 8,2% should the perpetual not get called.
CURRENT POSITIONS:
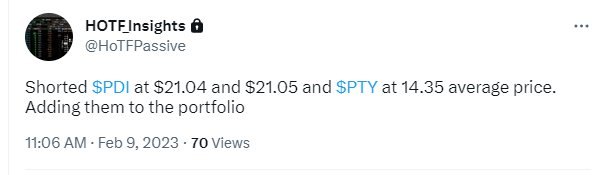
We have shorted:
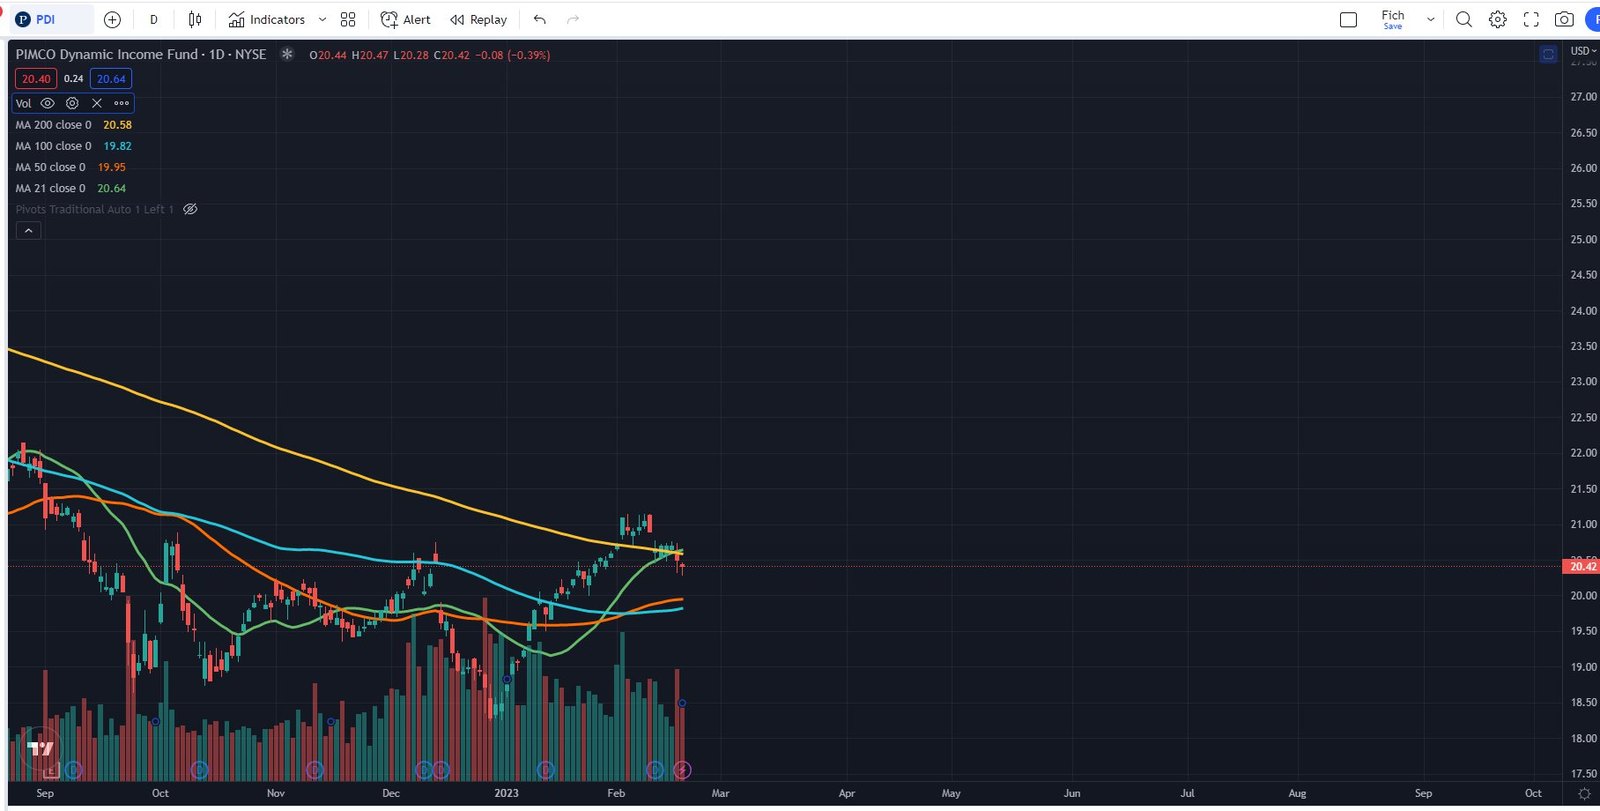
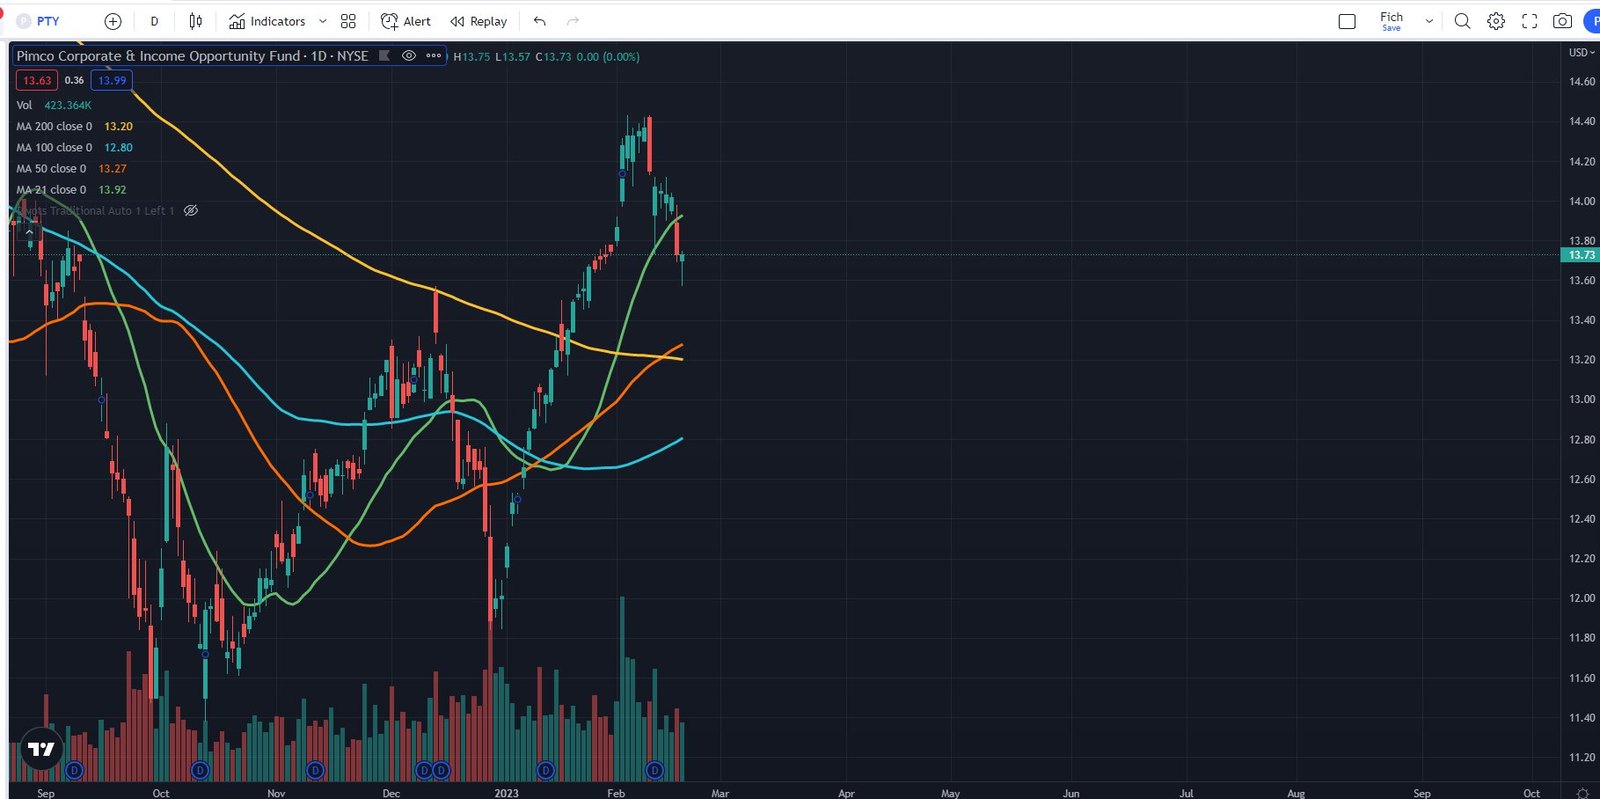
PTY and PDI on the 9th of Feb’23. The positions are now sitting comfortably at a profit. Current price of PDI is $20.42, PTY - $13.73
CONCLUSION:
The next 2 weeks will be important in terms of where the equity market heads. A sell off could spark credit spreads widening in the corporate world which would finally open up a world of opportunities. As of right now I am not planning to take any actions unless any of the positions in the portfolio gets stopped out or is at the take profit level. Until then I will focus on researching potential trade ideas and work on improving my scanners.
EQUITY MARKET REVIEW
General market overview: Alright guys, I am back from the vacation and ready to put some thoughts into paper. Cannot say I was totally detached form what was going on in the markets but preparing for the write up now I see that last week was a one big nothing burger with some nice intraday gyrations.
SPX was basically flat but it did provide action for the intraday traders. The color of the daily bars is quick to remind us that flat for the week would hide from us that there barely was a day where the overnight gap downs were not met with buying during the session. Despite higher inflation, higher revisions and still strong job market advocating for the so called higher for longer, the market held steady. Cannot say that this changes in any way my current view that the better risk reward is to the downside, but facts are facts and have to be stated objectively.
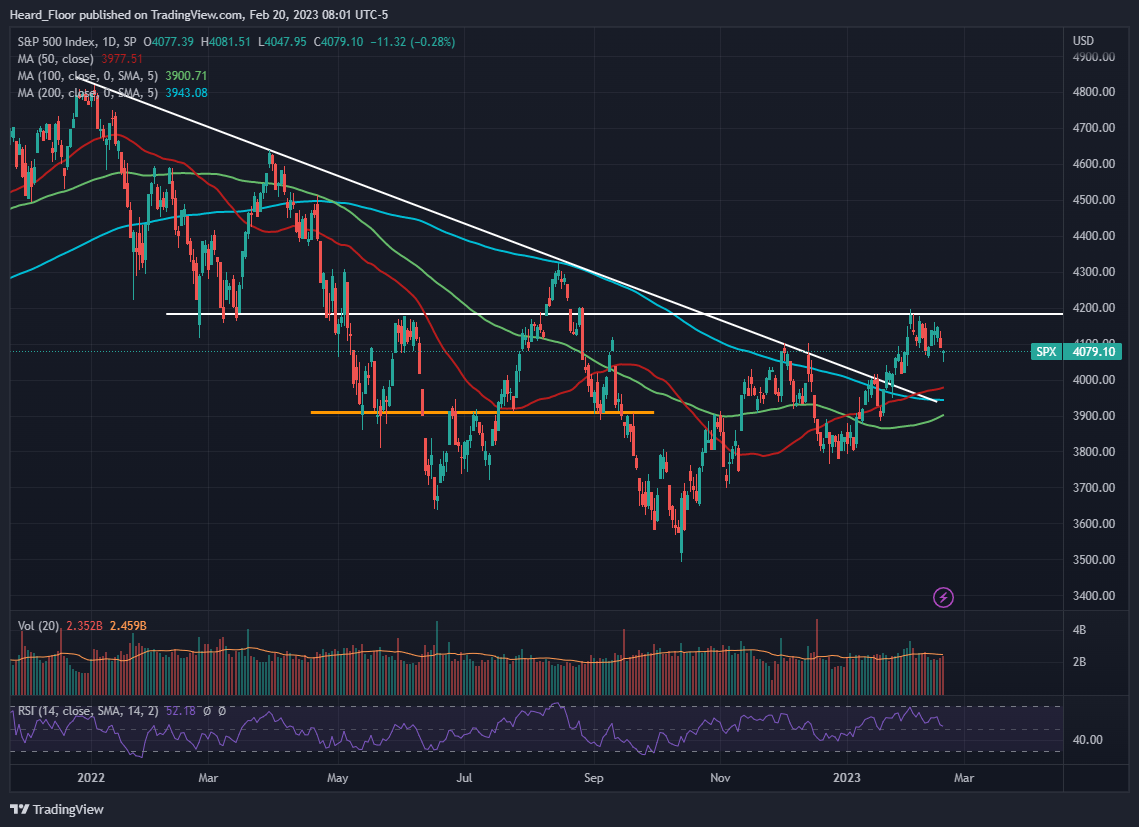
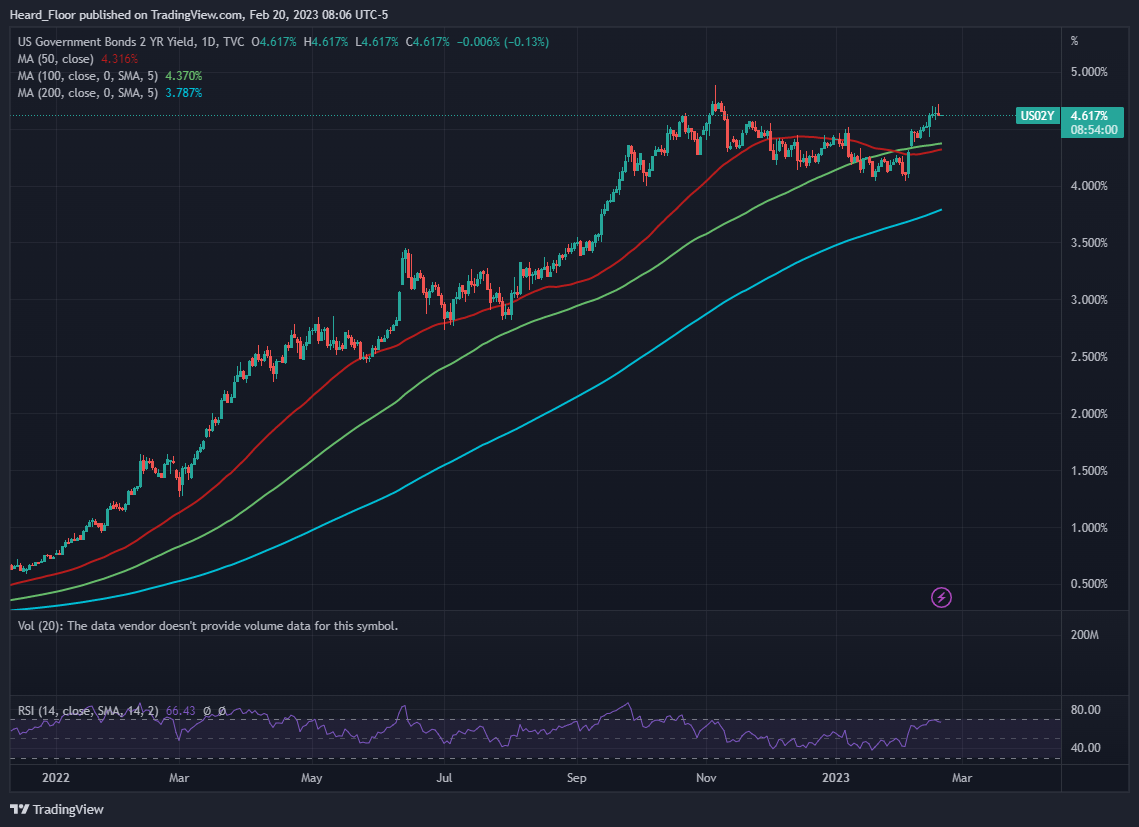
What is more, SPX is reluctant to listen to what is going on in the fixed income world, where rates continue marching higher. The yield curve is getting even more inverted with long rates being relatively farther from the 2022 highs compared to short rates all the while the US02Y being one lick away frmm closing above them.
The Eurodollar market continues the trend of hitting every bid it can find, cementing the higher for longer view now being thrown around in twitter under many hashtags (#bigflip, #H4L).
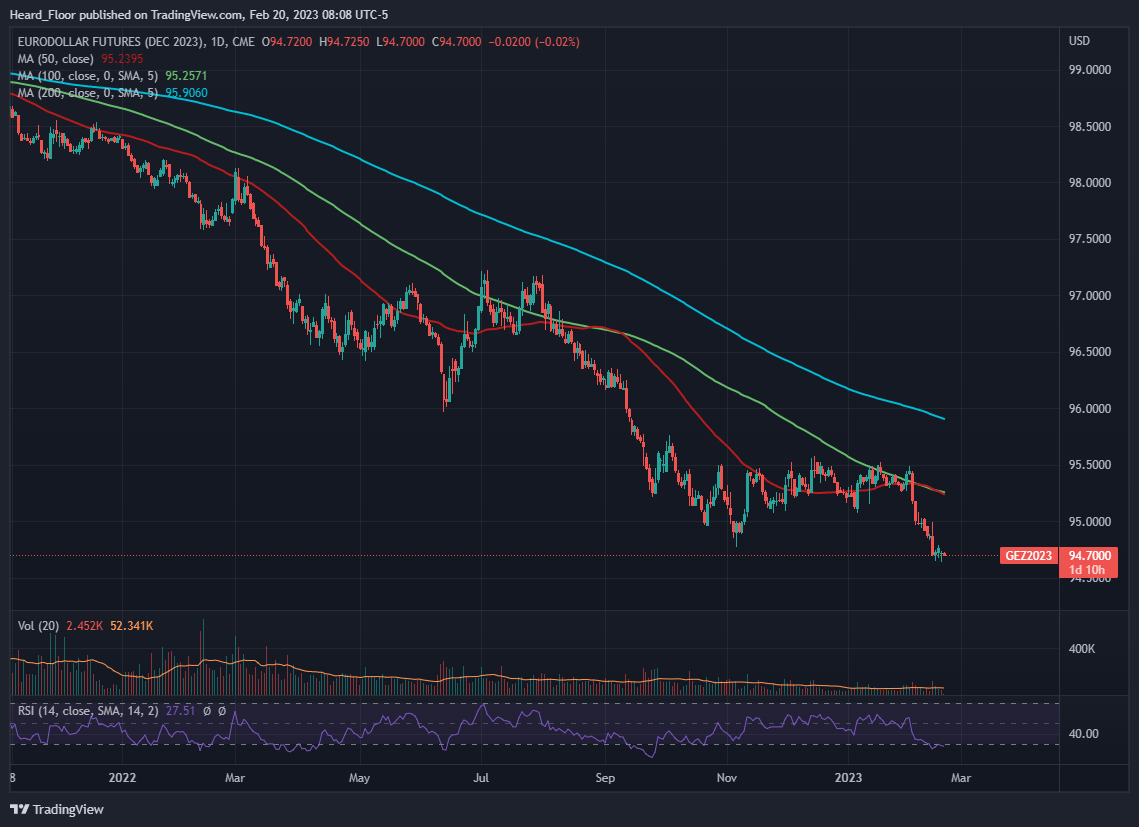
Name it how you wish but hundreds of bps hikes in a matter of 1 year will work with a lag, as many, including the big boss Powell has said. While in the short term it is all about positioning and it looks like people still want to get long stocks, do not forget the REAL effect of interest rates will come kicking on the door. I know this does not come as news to you, but I am left with the impression there are a lot of folks with ‘have fun staying poor’ comments under posts that advocate for caution in equities. In my humble opinion, the game has changed significantly with 3m bills yielding 4.7%. I rarely post research here, but I have decided to do so as I think some of you might be feeling the FOMO that is now having a hashtag to it. I understand #H4L is about rates, which makes sense to me, while #bigflip is both rates AND equities. Both hashtags have good arguments and I am not here to prove anyone wrong. I try to be as agnostic as possible. What I see though is the misappropriate use of the tags which in a lot of cases are only building FOMO. This is how herd behavior is formed, anyway.
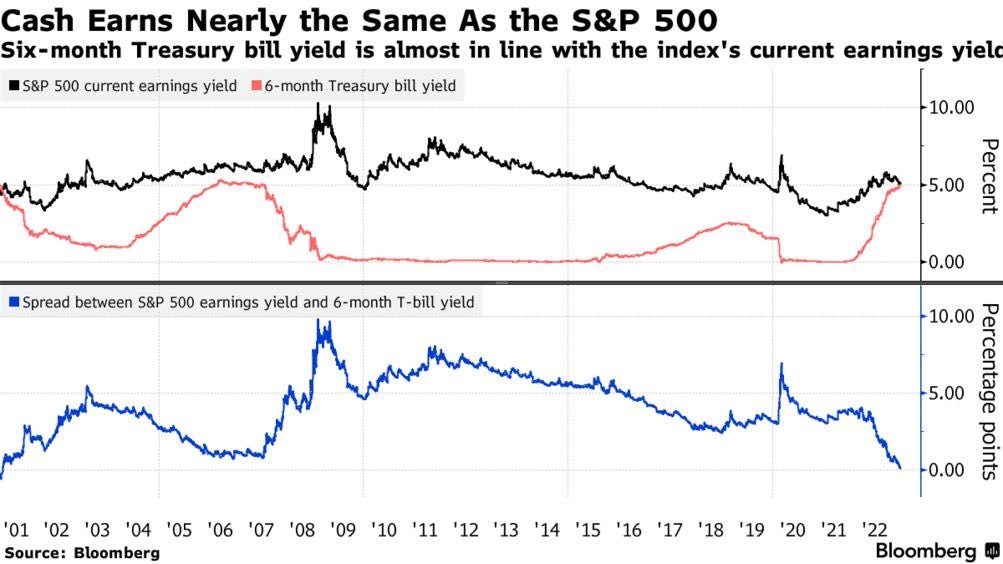
From there is no alternative (TINA) to there is only one 1 asset that is guaranteed to give you within 6m an annualized rate of c. 5%. But what about savings? People are full of cash. Yes, people were full of cash and the rate by which the cash is spent (not considering eaten away by inflation) is impressive too. Cash piles are coming down, just as the good effect of the inverted yield curve and high rates is.
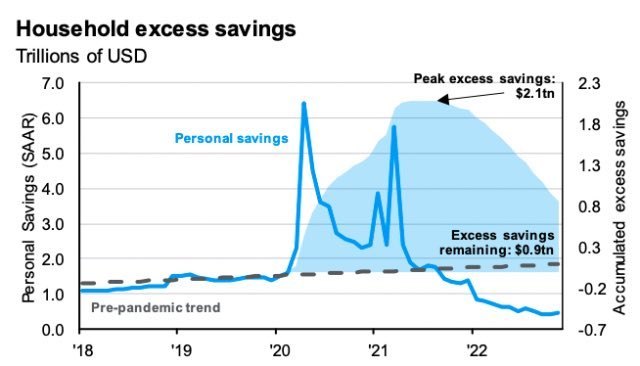
Sorry, did not mean to get into a time horizon than is way different than that of my trades, just wanted to point this out. If you are not risking your career being long 3m or 6m bills while waiting for clarity, my advice is to do that. And of course, if you are willing to take reasonable risk within the fixed income world, check out our FI portfolio.
Sector overview and potential trades
Few things stood out last week - energy and small caps
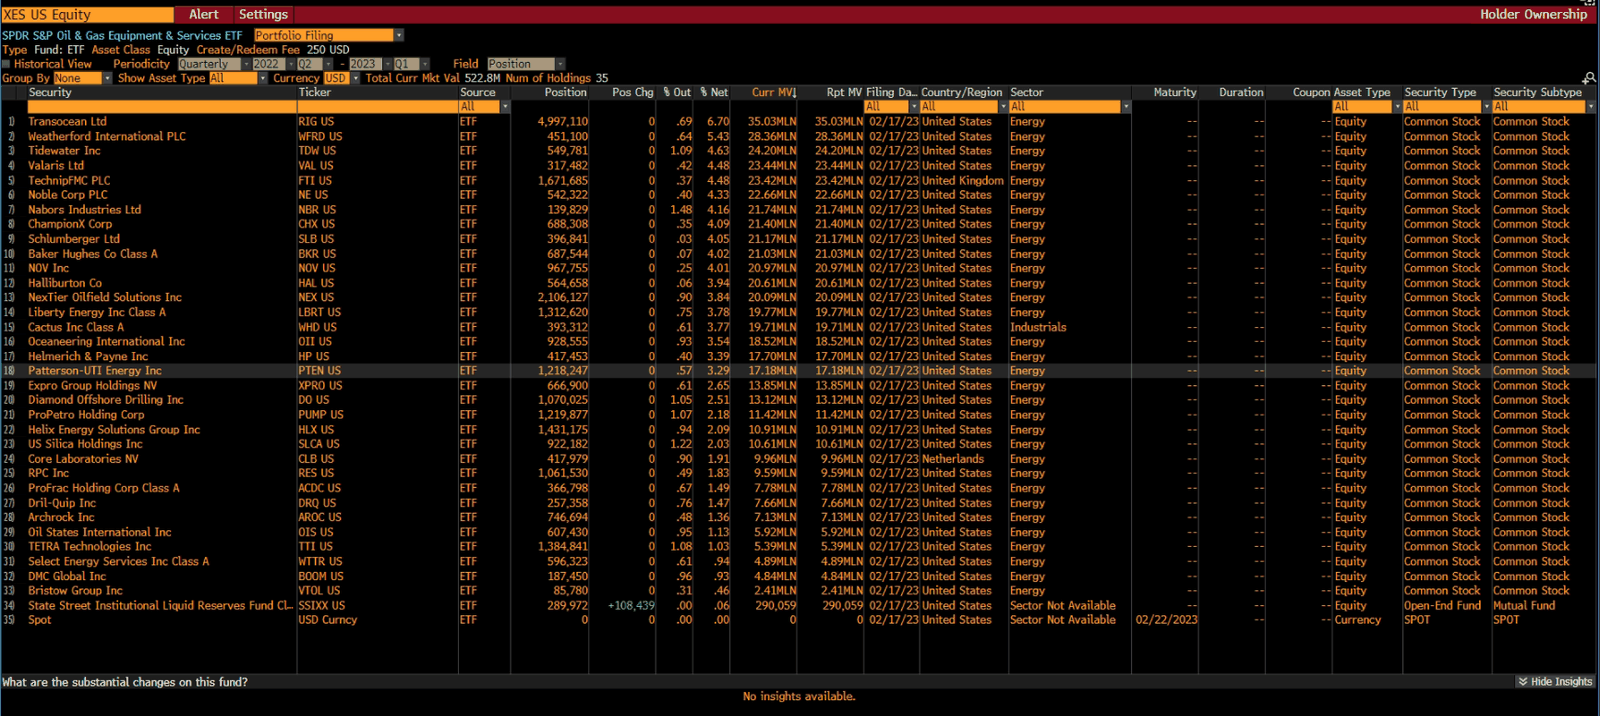
First, there was the butchery in the energy space. Not a lot of sectors are flat YTD but the homerun sector from 2022 is. While oil has been in the sticky 70-80$ range for a long time and XLE has gone basically nowhere, look at how the oil & equipment ETF (ticker XES) has performed.
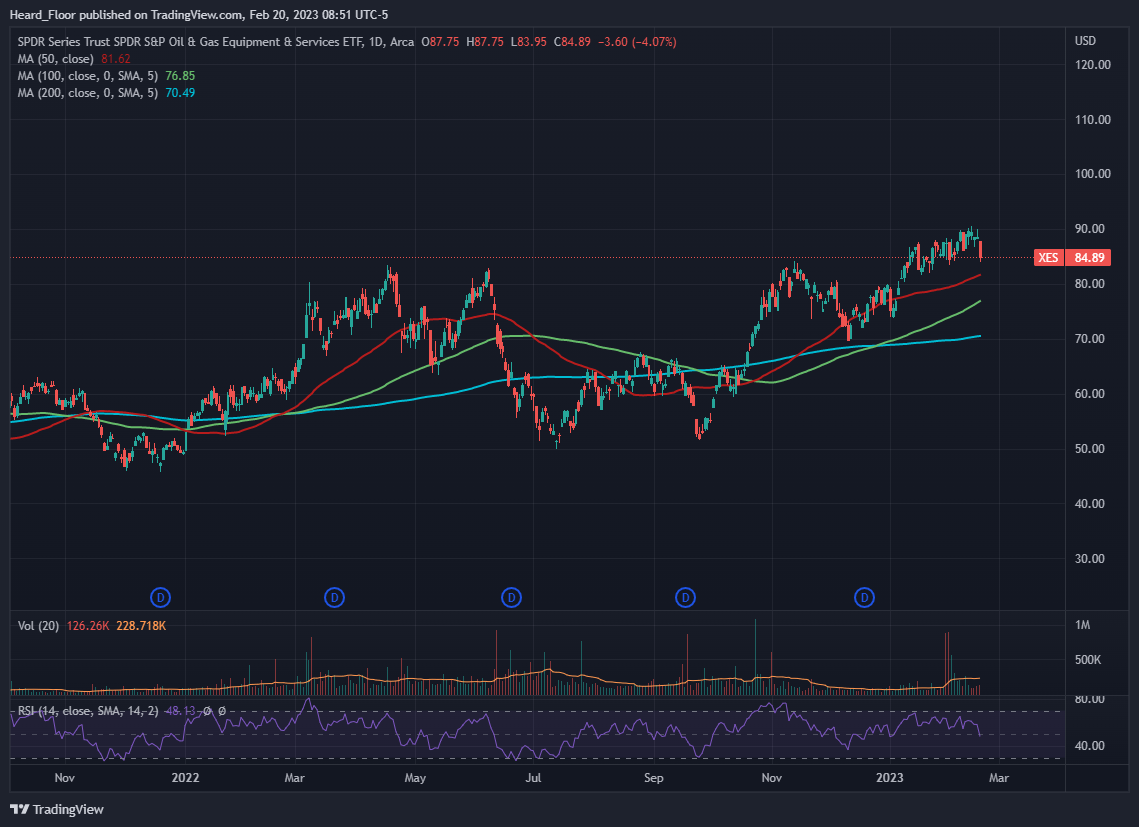
To the naked eye, it looks choppy, but on a relative basis, they had outperformed the other ETFs in the space by a mile.
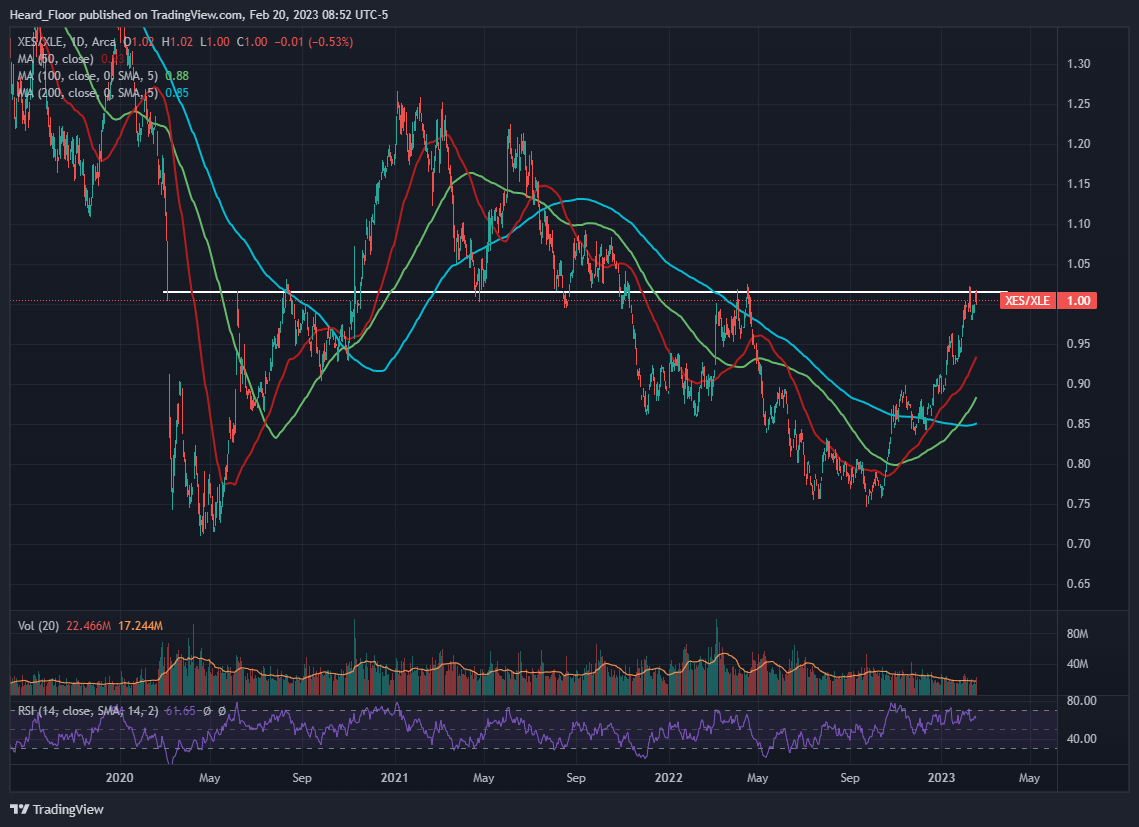
If you are into ratio trades, this might be something of interest, as the level of XES vs XLE is eye-popping here. I am not a connoisseur in the energy space, but I know XES is full of offshore drilling, having big exposure to RIG, TDW, VAL.
If it was not our friends from KEDM.com who were preaching some of those names on the long side I would have definitely tried to fade some of this move. But given how good they seem to be at their picks, I would rather skip.
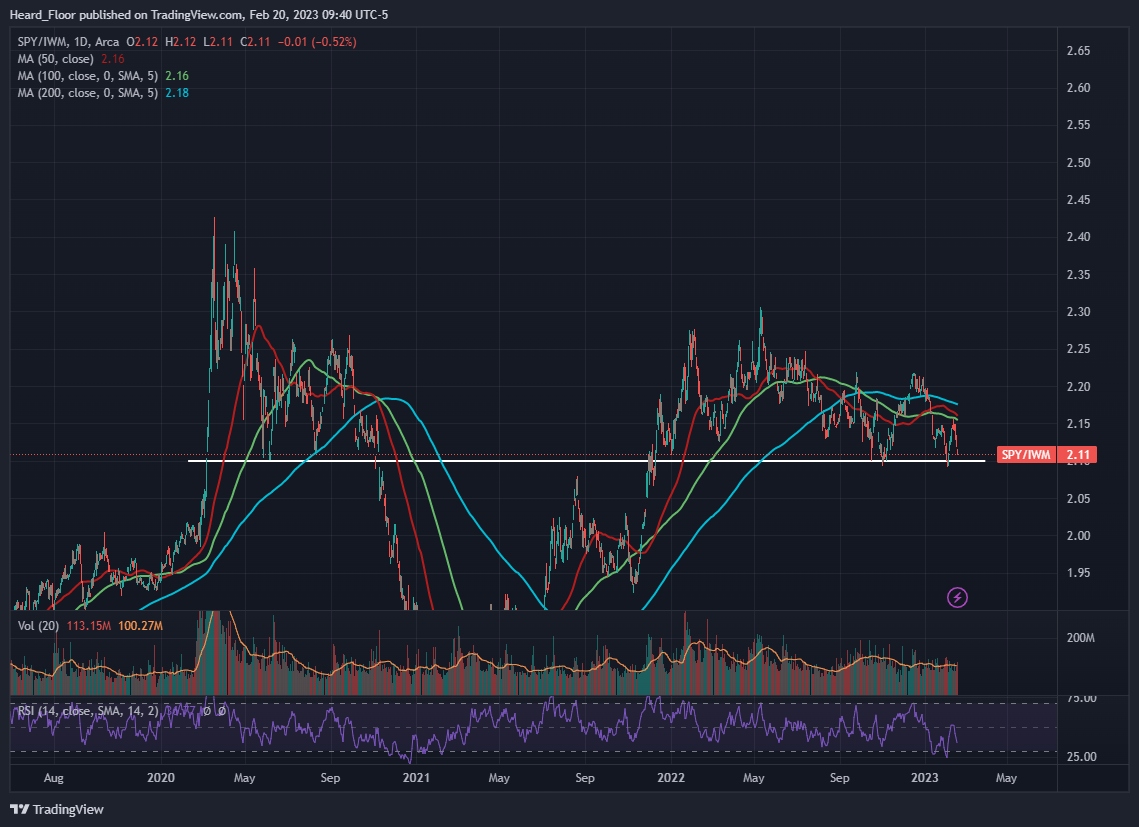
Second, there was the blatant outperformance of small vs large caps. IWM just refused to downtick and finished the week on a green territory. On a relative basis, things are starting to look good for a long SPY vs IWM trade again. I was extremely lucky to catch the move from 2.10 to 2.13 a week or so ago and I am now following closely in case I decide to dip my toes again into the trade.
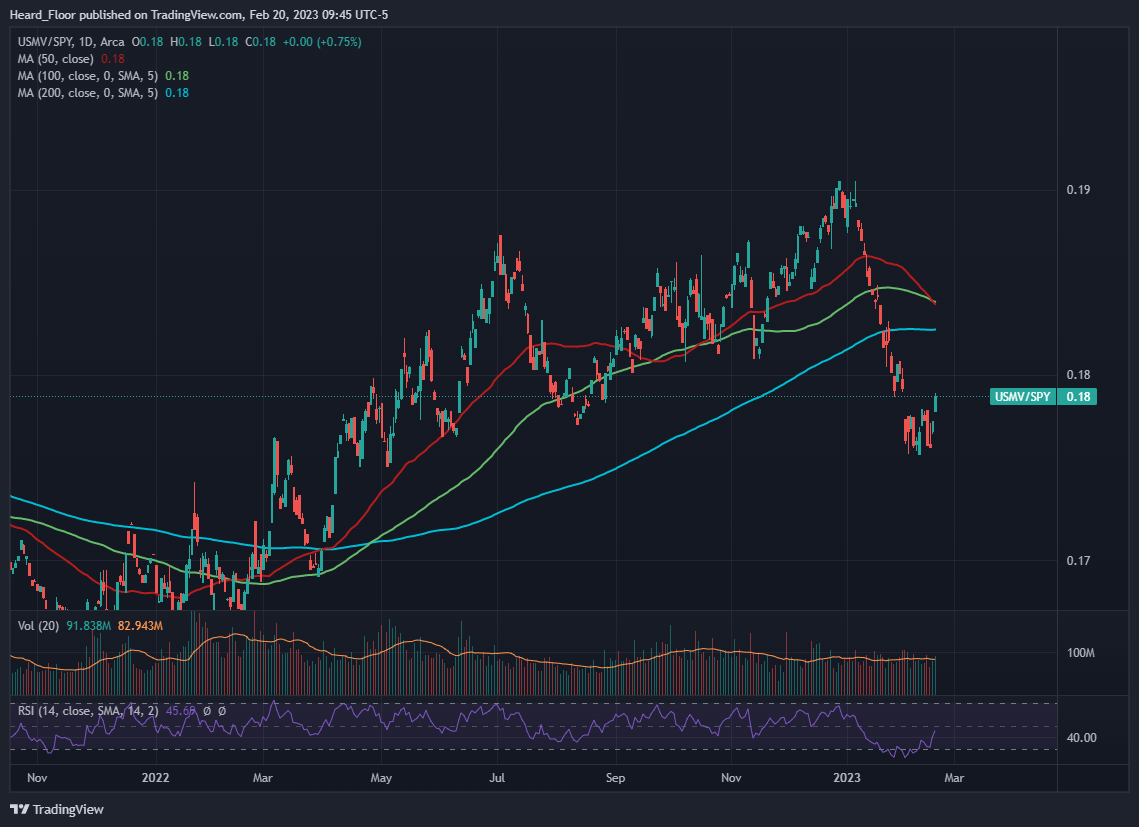
Current positions: I am long USMV vs SPY (2/3 risk)
The defensive names were acting well on Friday. XLV, XLP and XLU had a monster day compared to SPY. Given that the low volatility ETF (ticker USMV) is full of companies from those sectors, it made a nice move up and I felt the need to take some profit. Still in the trade, still liking it.
Conclusion: Despite the intraday gyrations and everyone speaking about 0DTE SPX options, nothing really happened last week. Eurodollar futures continue to the downside and despite what high rates mean for equities my eyes are seeing some FOMO behavior. With short term rates this high and SPX circa 4100 getting long equities seems a poor choice. I am left looking for an overextension plays of ratios to put mean reversion trades on. As usual, patience is essential.
This is OFM Capital’s own research, published for information only. It is not investment advice or an offer of any kind. We may hold positions in the securities mentioned.