
Knock, knock. Who’s there?
First published in Heard on the Trading Floor
Written in February 2023. Prices, yields and positions have changed since.
We have decided to combine the Equity and Credit market reviews in one piece.
We have done so in order to decrease the amount of e-mails you receive from us as we understand how spammy the world of Substack has gotten. Plus, we hope those of you who have been strictly focused on reading one of the reviews to accidentally find value in the other as well.
We are constantly trying to improve the way we write and lay out our thoughts in markets. Hope you like it and don’t hesitate to tell us what you think.
BOND MARKET REVIEW
Things were looking hopeless for the bears up until Friday. The bond and equity markets showed us the true meaning of grinding higher. There was a lot of frustrations from the shorts and understandably so.
One may think that only if he/she shorted on Friday they would have had a nice week. Thing is, you never know when this grind higher will stop. The unemployment data could have as easily swung the market the other way, if it turned out to be worse than the market expected. This is a binary event which I personally don't like. I mean from a trading perspective, how can you position yourself to take advantage of a randomly generated number? This is not how I like to trade.
Looking at Twitter over the weekend it made a big impression how bearish people got all of a sudden. There is even a #bigflip hashtag trending. I mean, I am no bull at these prices and believe the upper ranges of SPX should be shorted but preaching for a revival of inflation and the subsequent sell off in the market from one clearly erroneous data point is simply far fetched. The engagement farming is just wild. Don’t get fooled, this is exactly what it is. There may eventually be a turn around in inflation and subsequently a change in the FED’s policy but that doesn’t happen overnight. Don’t fall for the hype. The markets are never so black and white, there are at least 50 shades of gray (pun intended)

WHAT HAPPENED AFTER THE BIG NUMBER?
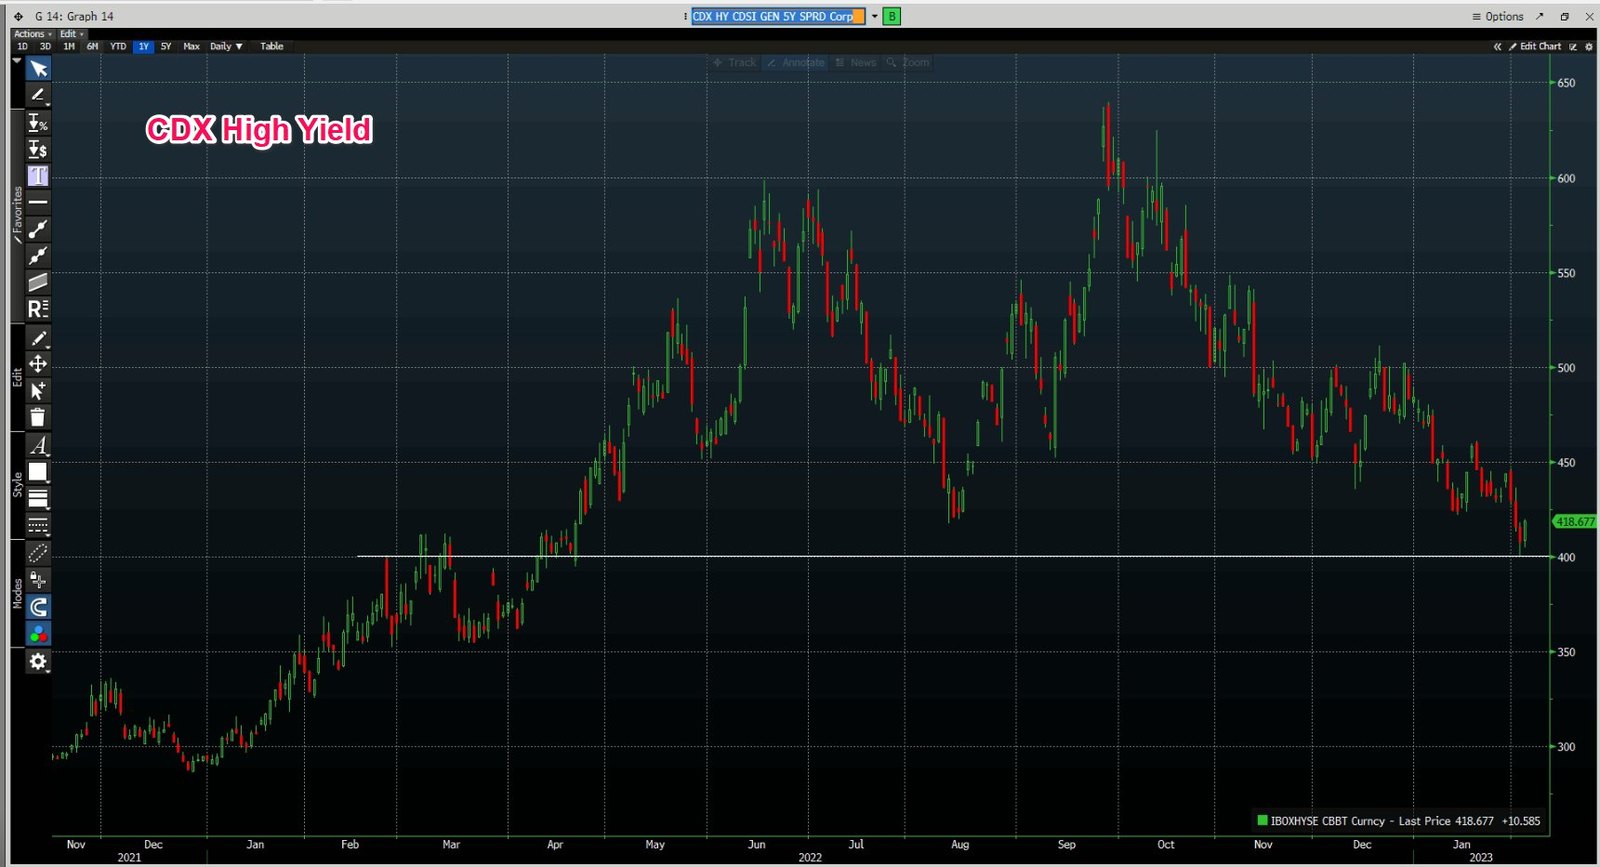
We finally saw an uptick in the CDS indices. It was about time and there is no surprise. The CDX High Yield index was trading around the 400 level for some time and I believe it was customary to to see a reaction from that level, purely from a technical stand point. The move is not as wild but it may build momentum if SPX tests 4000 next week.
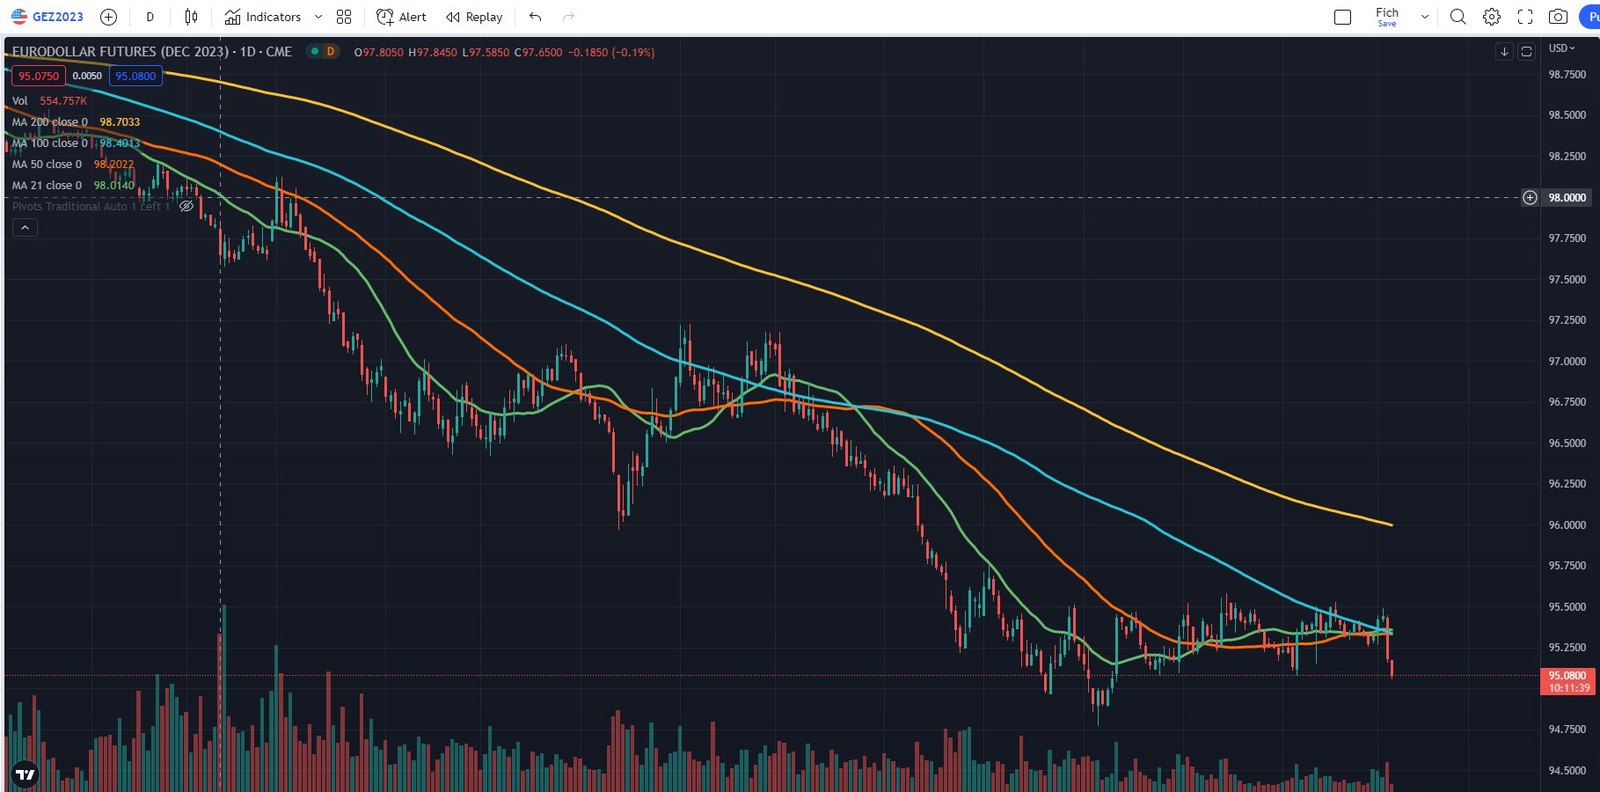
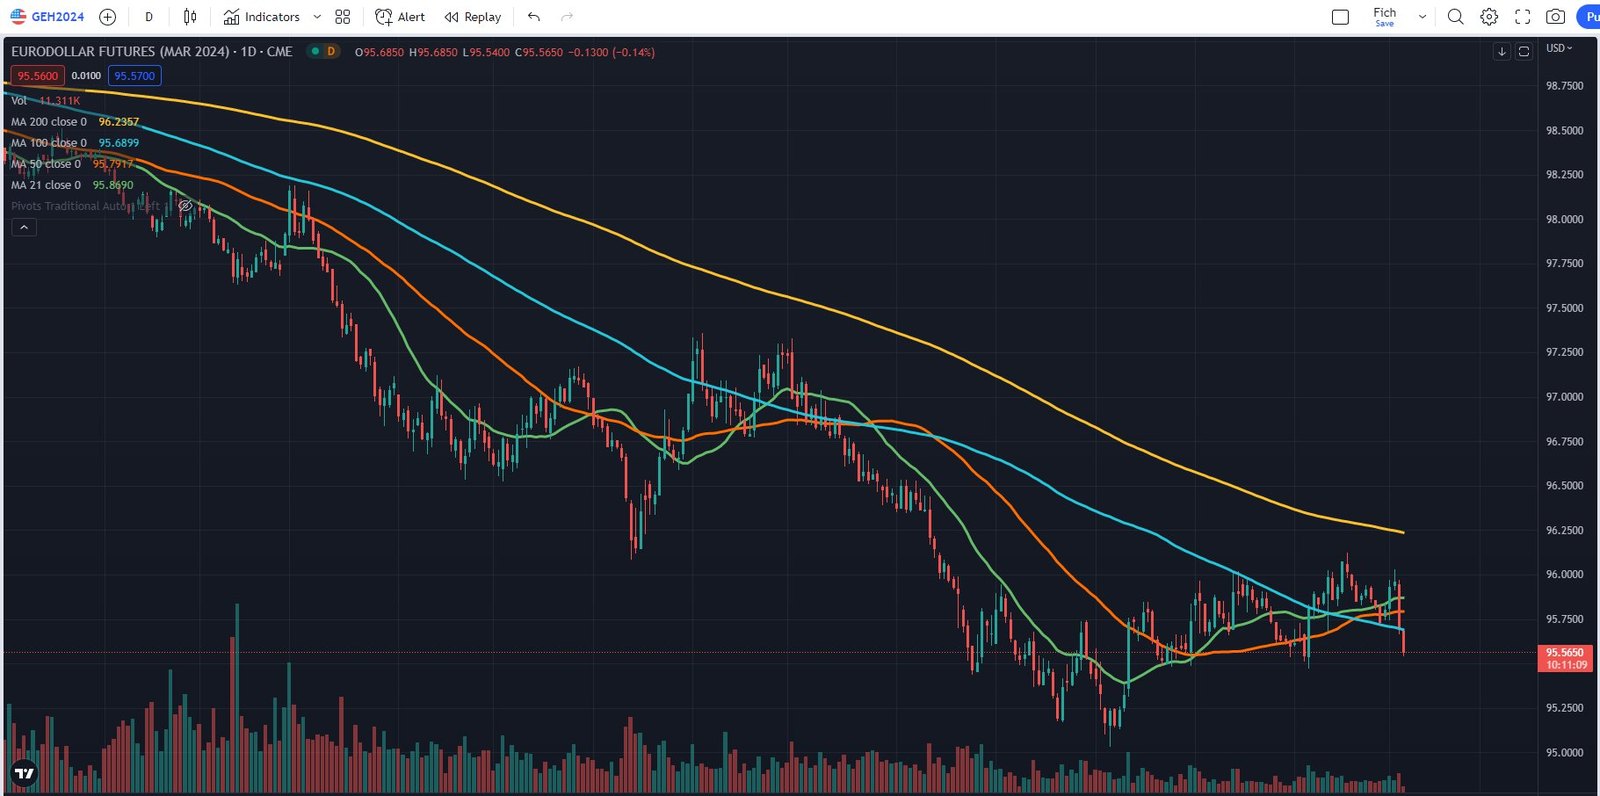
End of ‘23 and beginning of ‘24 Fed Fund Futures are finally moving. They are now pricing less cuts and insisting that market participants are believing in the higher for longer narrative, of course, fueled by the very surprising NFP numbers. The Dec’23 and Mar’24 contract wiped out 50bps of cuts. At the very moment, higher for longer is very real. This would certainly lead to repricing in some fixed income instruments.
The ETFs
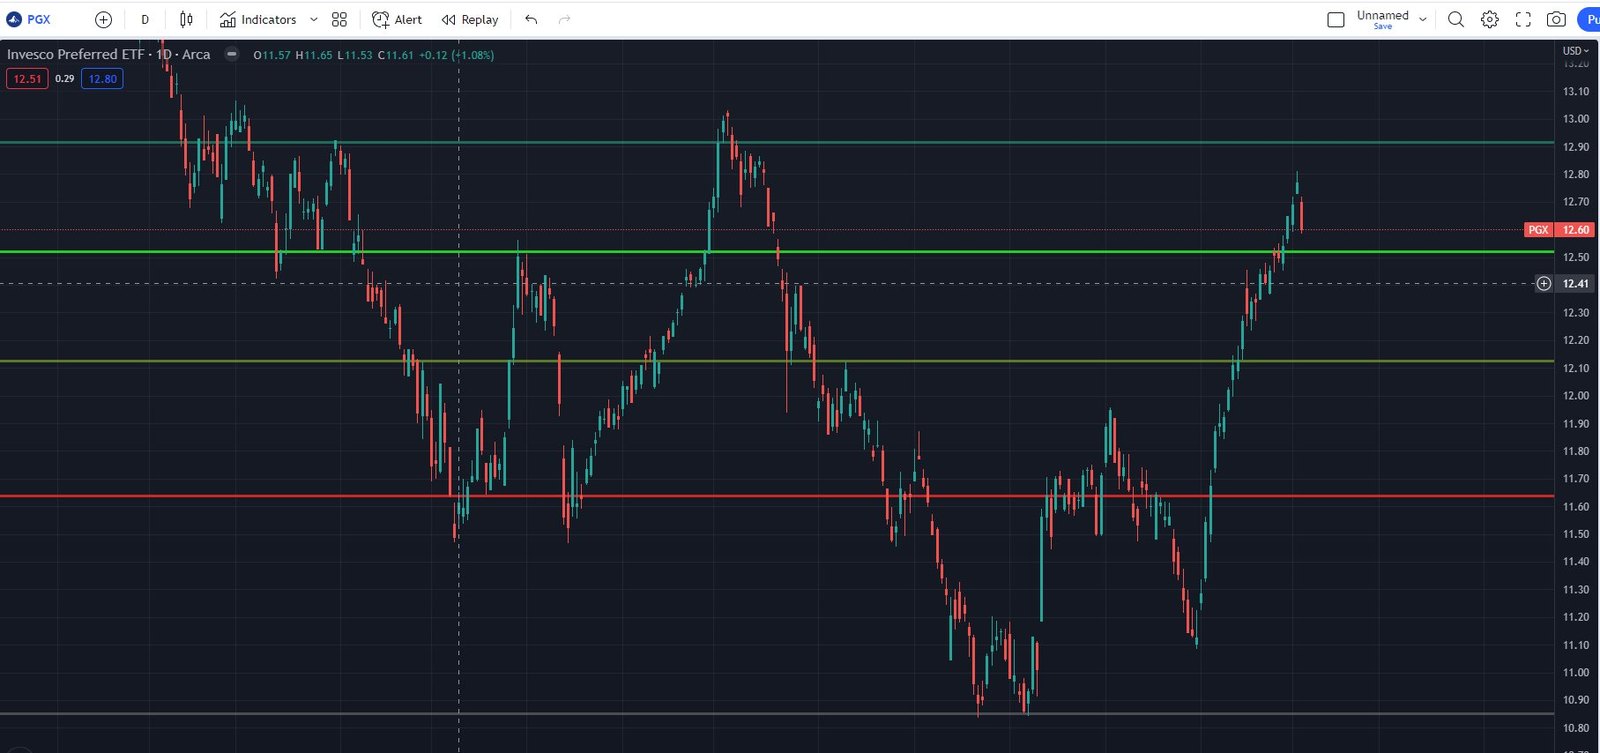
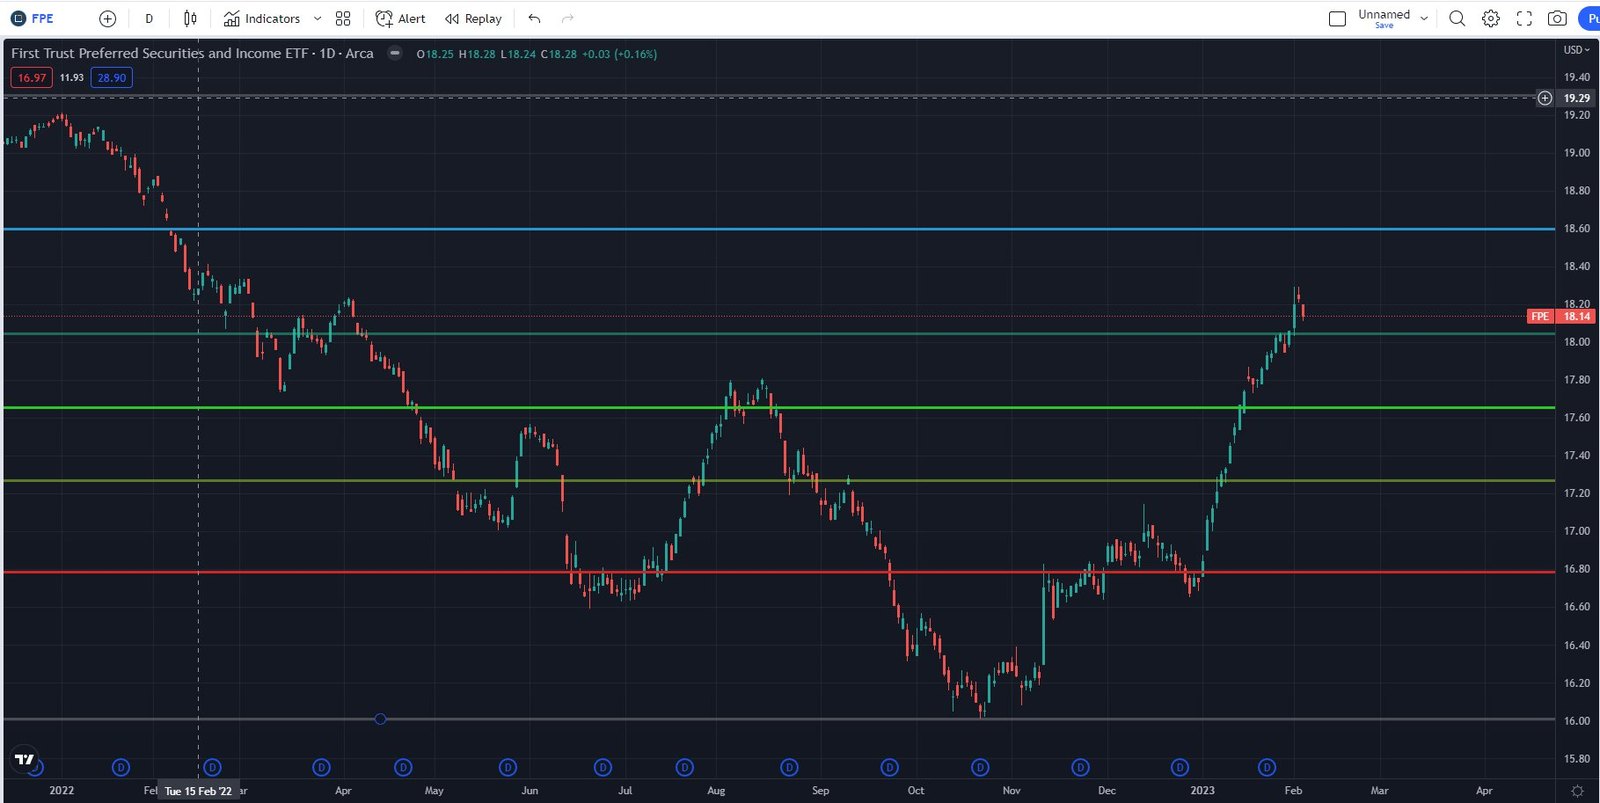
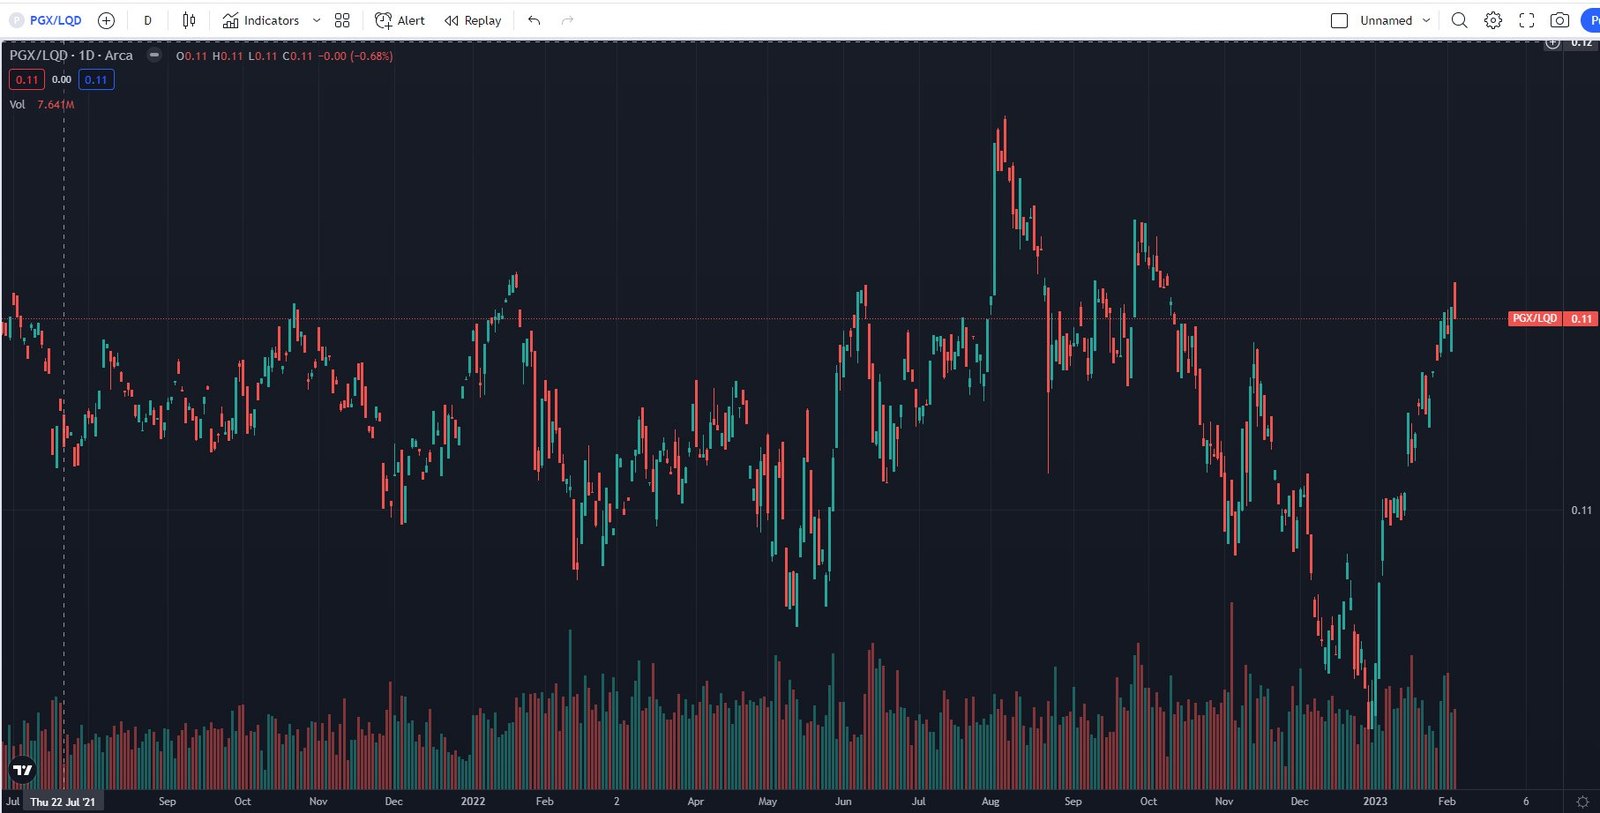
We finally saw the ETFs have a down day. My beloved $PGX and $FPE were looking like one of Elon’s rockets. From a technical point of view, I am thinking we may test $12.10 in PGX and $17.60 in FPE if the sell off catches on. It goes without saying that shorting in the hole doesn’t feel like the right thing to do. You will do well if you manage to short the occasional preferred stock that is lagging the move (if there are any left) , especially in one of FPE or VRP’s holdings (They are slow to react, aren’t they) but I personally don’t like shorting cash products as much due to the NEGATIVE carry one has to endure. If I want to short a perpetual I would have to pay the borrow fee and dividend/daily accruals while holding the shorts. On top of it the slippage is a real killer in these products. To be a successful short-seller in the credit world, your timing must be immaculate. If you don’t get the timing right, the costs eat away your potential profit. My timing certainly isn’t the best out there so I tend to stay away from shorting credit via cash products. I prefer shorting the ETFs like $HYG $PFF $BKLN and the rest. The negative carry is reasonable, the liquidity is excellent.
I may get fooled once or twice per year to short a cash product but as the years go by I do it less often. The opportunities must be worth a lot more than the negative carry I make sure that I can hold at least 2 months without worrying about the carry. I guess it finally dawned on me that, shorting cash credit is like flying against headwinds. Being long credit products is benefiting from tailwind.
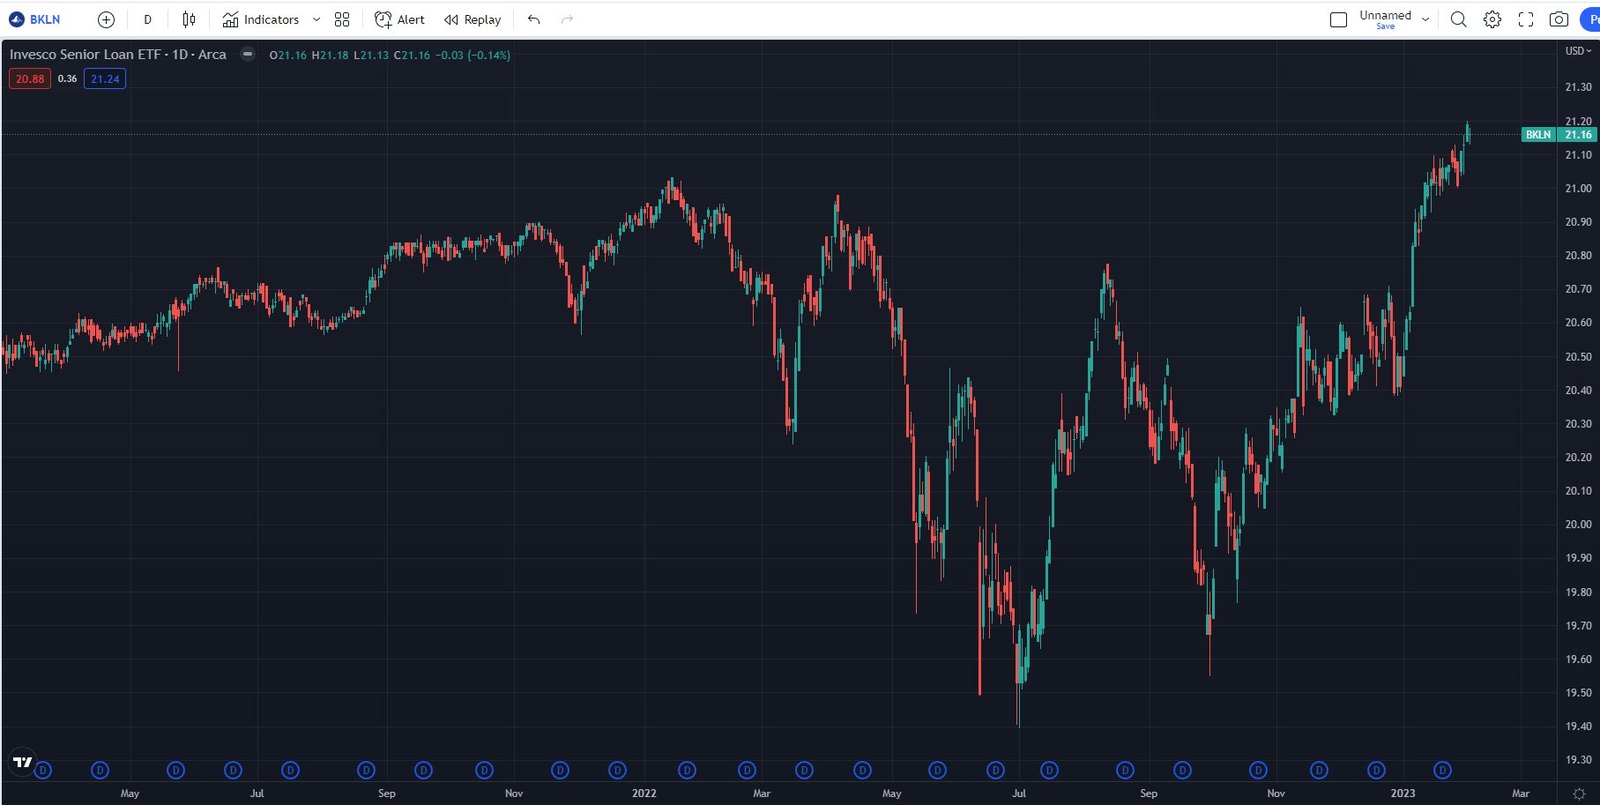
BKLN - Senior Loans
Trading wise I don’t see much. We made new 52 week highs last week but I wouldn’t consider that in any shape or form as a signal to do anything. Just being Mr. Obvious here. I guess the higher terminal rate + low bankruptcy levels is the sweet spot for Senior Loans.
MUB - Municipal bonds
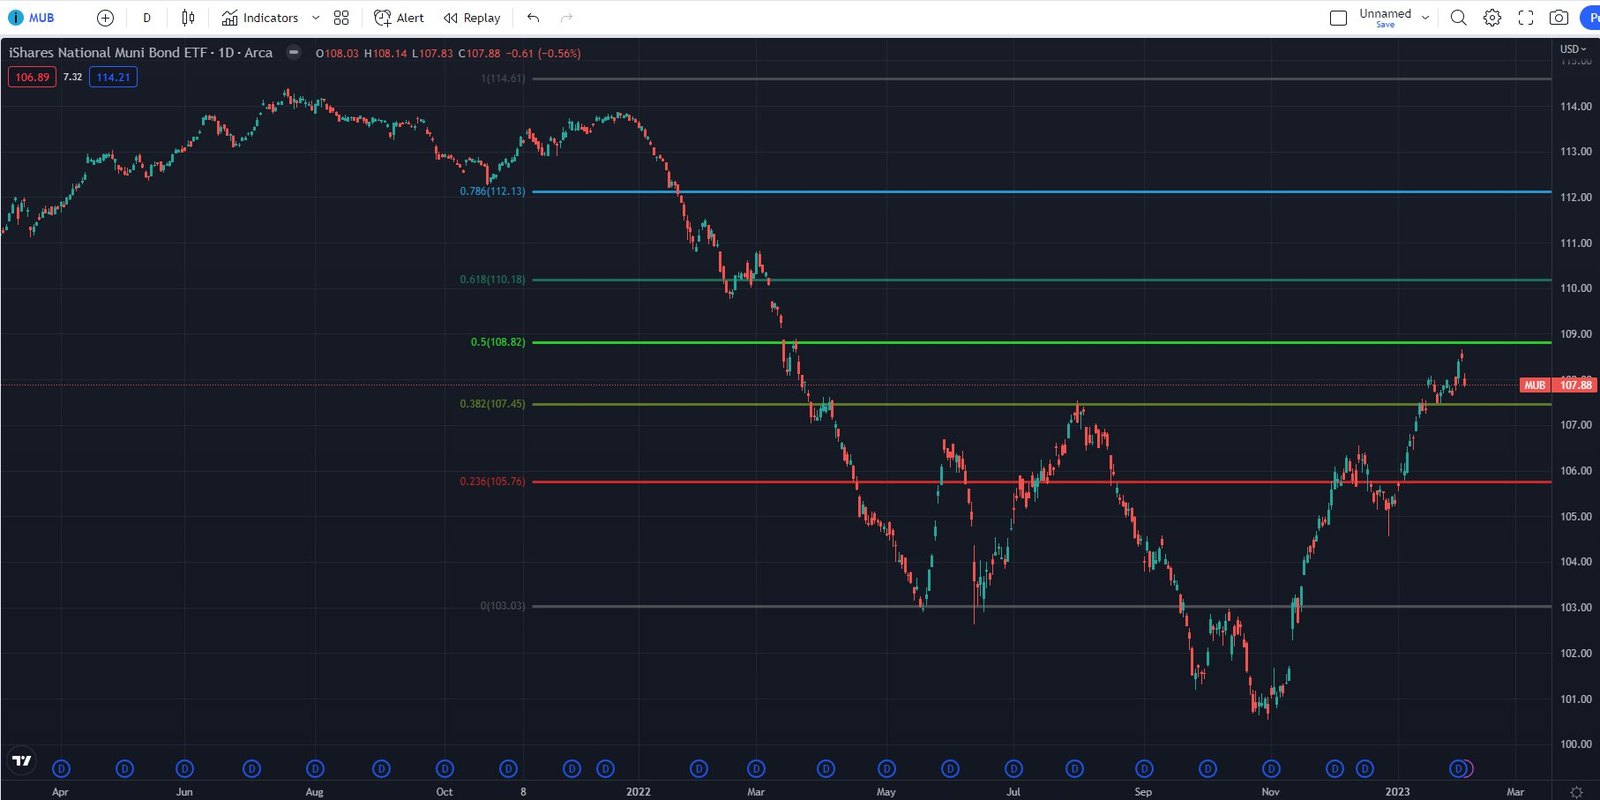
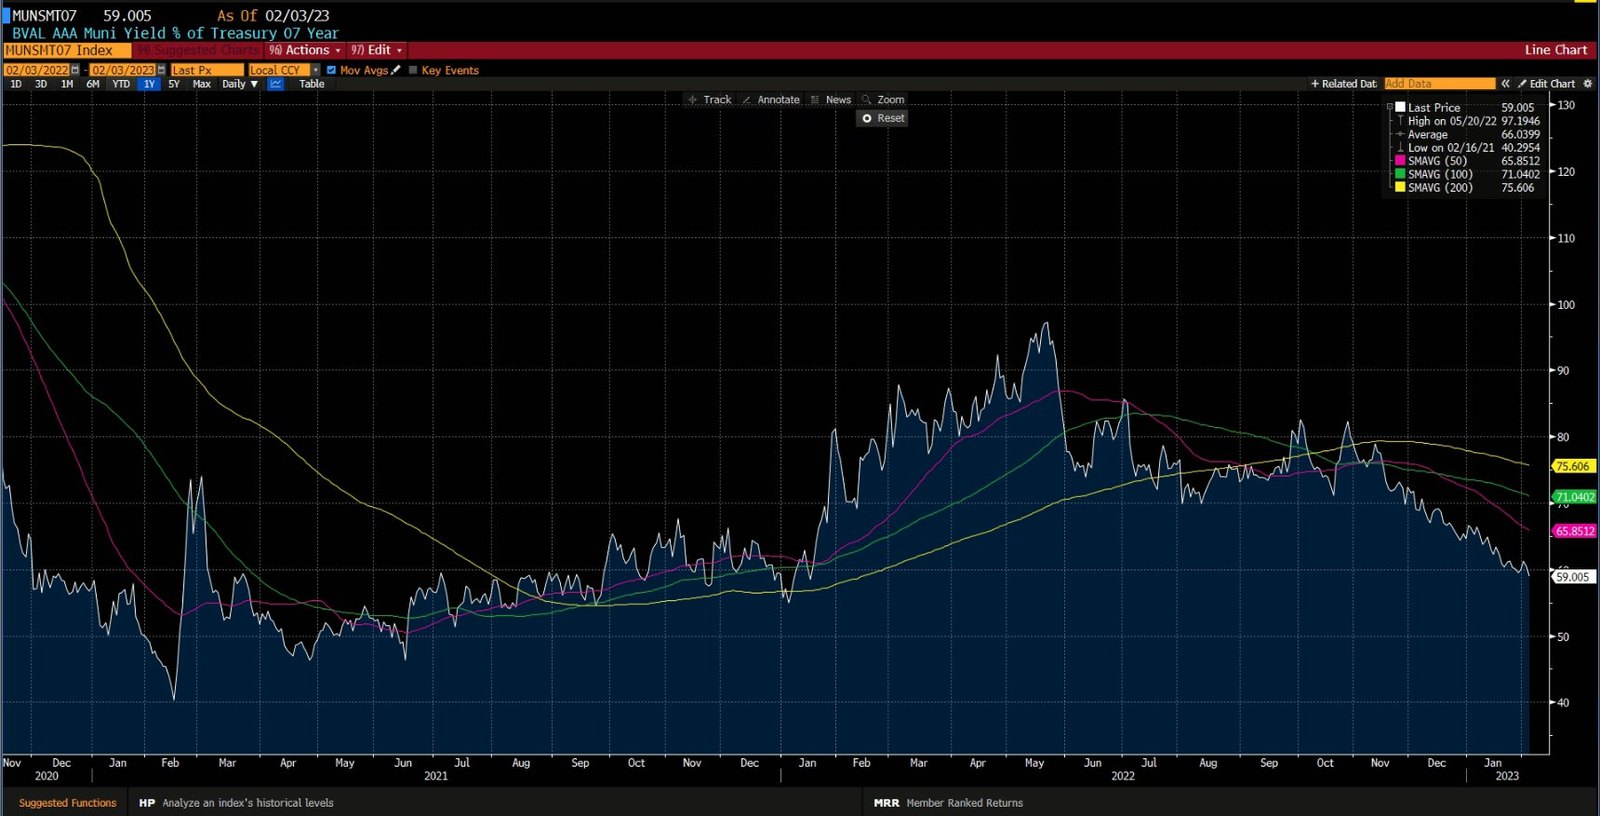
MUB (duration 6.39 ) also went ahead of itself and passed through its Aug’22 highs. Likely because credit spreads are tighter than they were back in Aug’22. In fact they are approaching rapidly approaching the 2021 lows in credit spreads. How about that?
POTENTIAL POSITIONS:
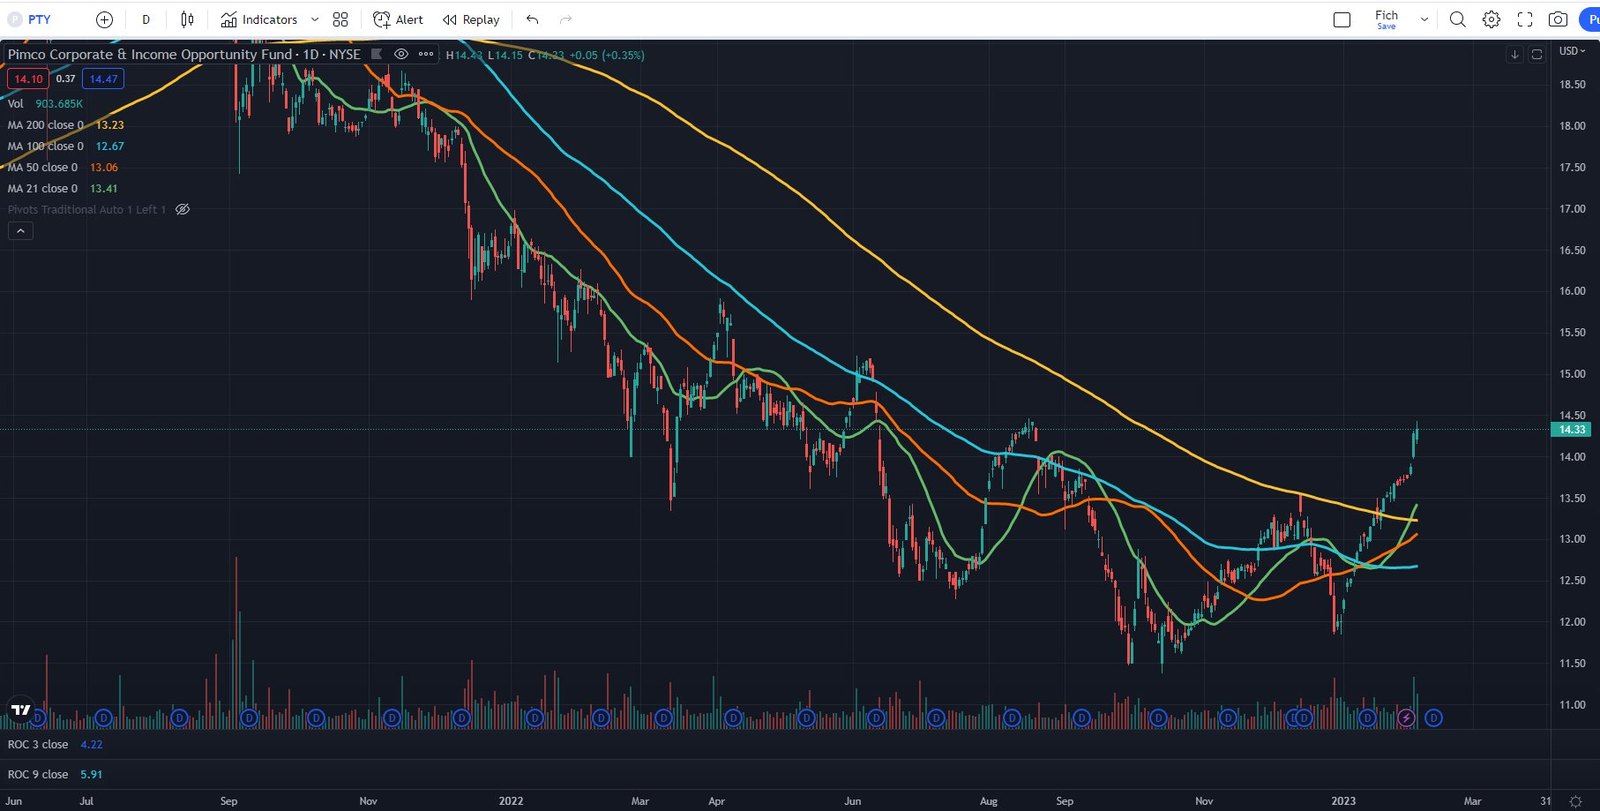
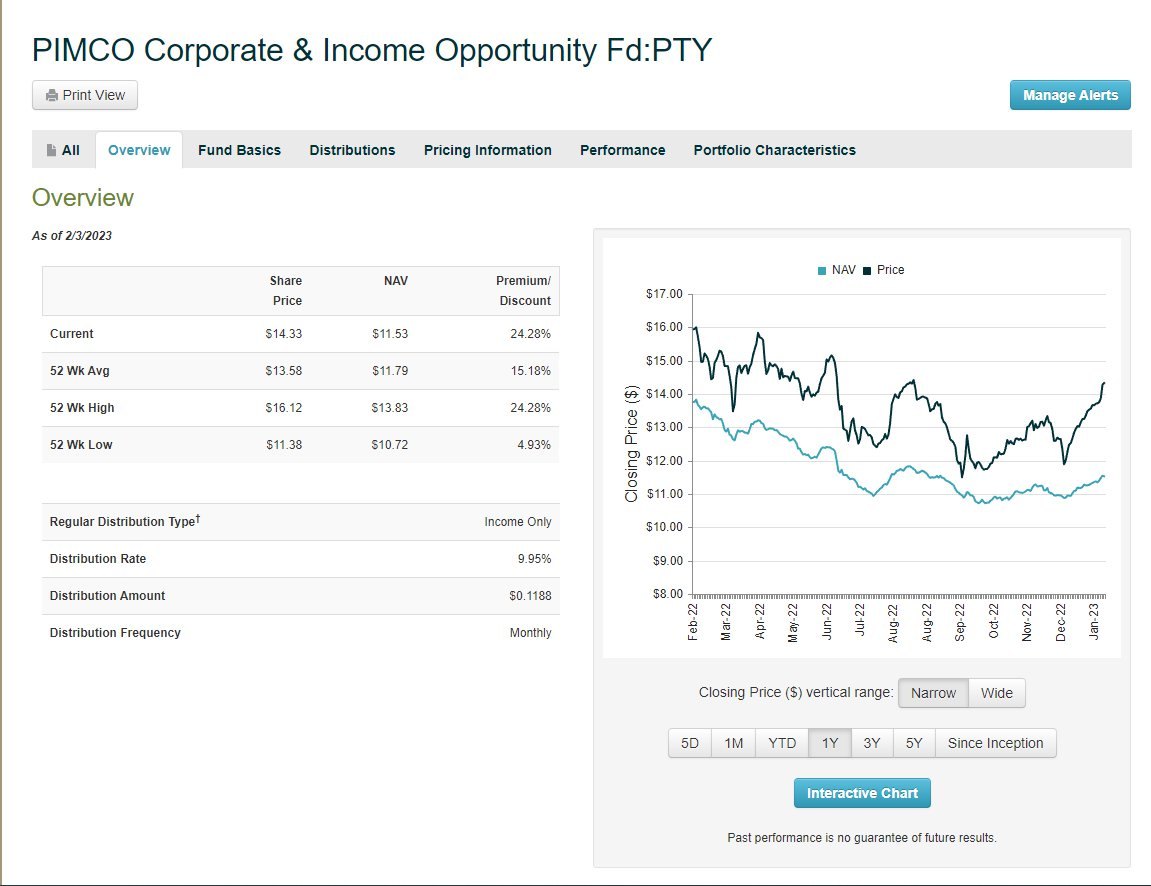
PTY - Currently at 52 week high Premium or 24.28% over NAV. Makes you wonder why exactly this is the case. Price is just at the Aug’22 highs while NAV is not quite there. Some things to consider
Liquidity for a CEF is very good but still should be mindful of the spread
Pays a 0.119c dividend on the 10th, so unlikely to do anything significant before the ex-div date
In 2021 PTY traded at a higher premium
CORPORATE BONDS:
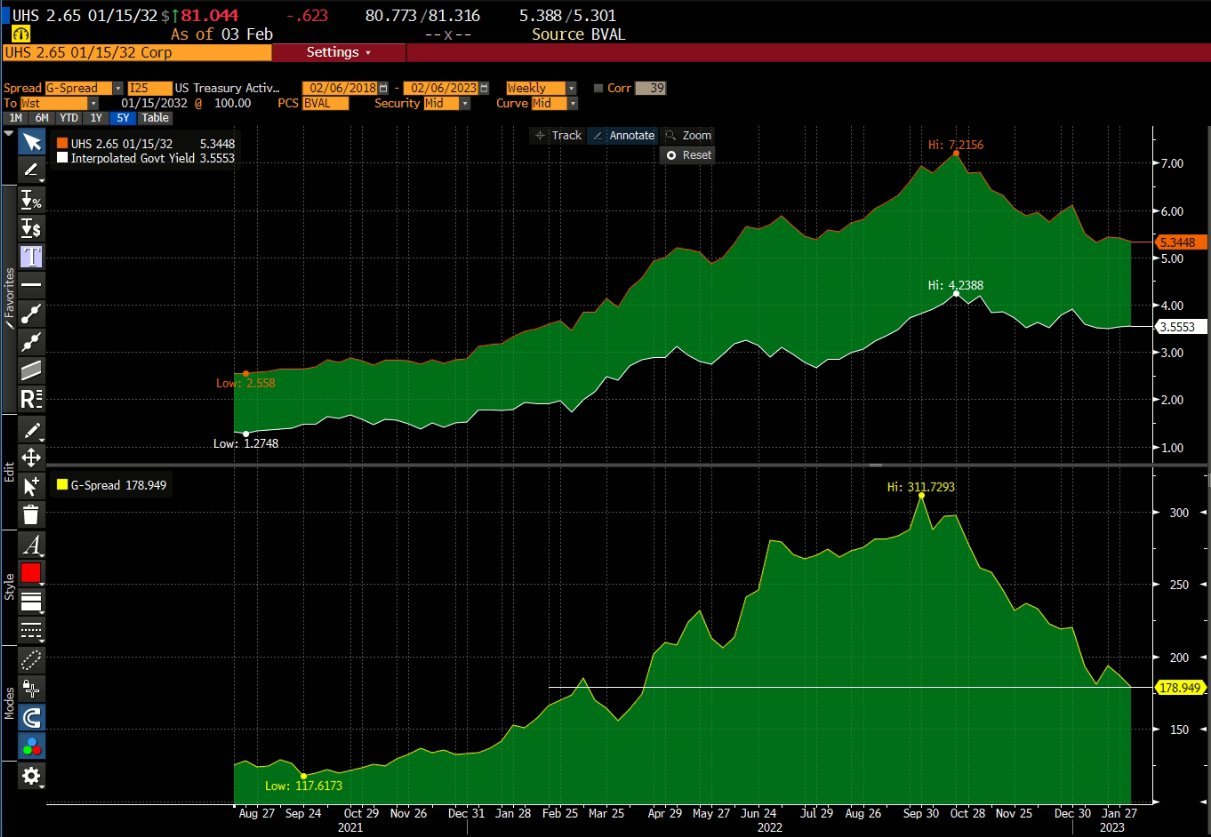
I found 2 corporate bonds that were close to their ‘22 Aug highs in cash price and at the same time lower in terms of G-spread. The lower G-spread is explained by the fact that we have tighter credit spreads than what we experienced back in Aug’22.
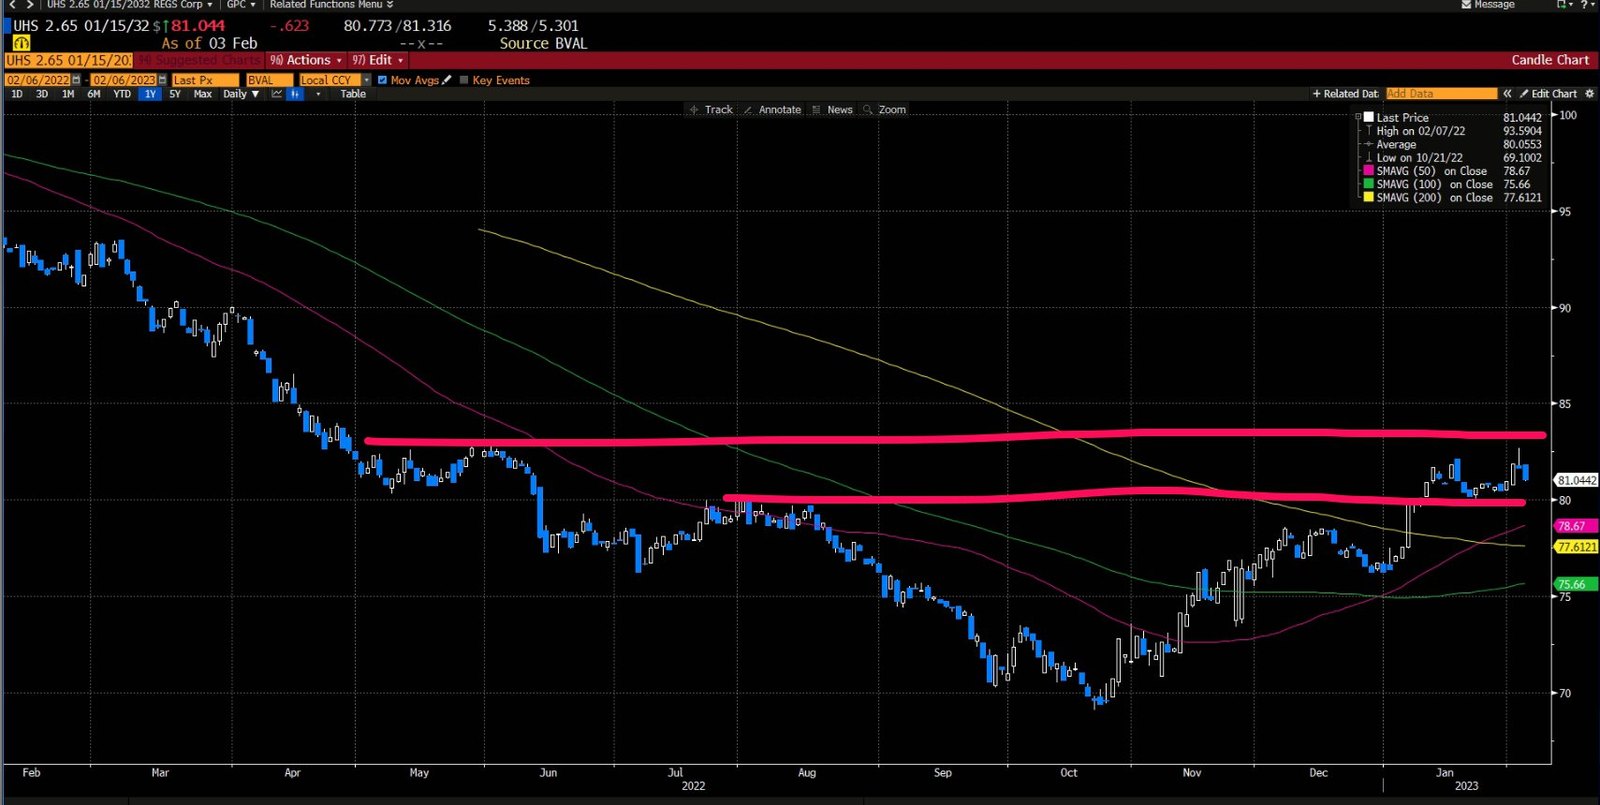
UHS 2.65 32s - Technically speaking, this looks like a good short due to the high cash price and tight g-spreads. One of the drawdowns is that this is a 144A/RegS. Unless you are a QIB (Qualified Institutional Buyer) , you would have to look for liquidity in the RegS issue, which is usually difficult to do. Not impossible, but difficult.
CURRENT PORTFOLIO:
PEMEX 10% 2033s vs EMB
This is a brand new issue of Petroleos Mexicanos. As I am expecting volatility to pick up in the next 1-3 weeks I had decided to hedge my exposure with EMB as I believe the benchmark ETF should be an excellent hedge.
Average price of long position 97.95 vs average price of short position 88.08. Currently the trade is around ~1.5% in the money. Upgrade your subscription for the full portfolio and the full list of potential trades for the week. We have identified 7 excellent potential short positions.
Most news you read out there is too generic, written by someone who has never invested or managed money or is just plain bad. GRIT Capital was founded by former $100MM portfolio manager Genevieve Roch-Decter who is on a mission to democratize access to stock market insights to the masses! Subscribe for free!
EQUITY MARKET REVIEW
General market overview: It is funny how when you end the week with a bad day, it feels like the world is going to end next week. It could be just me, but I doubt it. Writing this I find myself experiencing 2 different types of biases - a recency bias as I extrapolate the most recent feeling/price action and a short bias (sounds much less scientific, right) given my view on the market that appears to be a bit old dated.
I have realized things have changed, but the thought that a risk-on behavior in a world with soon to be 5% risk free rate and a wild curve inversion, to put it simply, deserves a bit more than a current yield of sub 6%, that many of the better rated preferred stocks offer. Yes, clearly, you get the juicy risk free for a couple of months as of now but, first, this could change, and, second, that part of the capital structure bears other types of risks (default, liquidity, dividend) that I am yet to find a guy who would convince me their valuation as of now makes sense. This is the equity part of the newsletter so I won’t go any further, but it is the part of the market that appears to me most stretched today and this is why I am saying it here. It contributes a lot to my short bias.
For me, knowing what my biases are is of utmost importance, especially after being caught wrong footed in the beginning of the year. Only this has saved me so far from piling into the short side more than I had. Overall, the damage done has been limited to only 2-3 attempts on the short side, which in the grand picture of things is extremely benign.
On Friday, after the huge miss in NFP expectations, the yield curve move up and a rate cut was erased from the Eurodollar December 2023 futures.
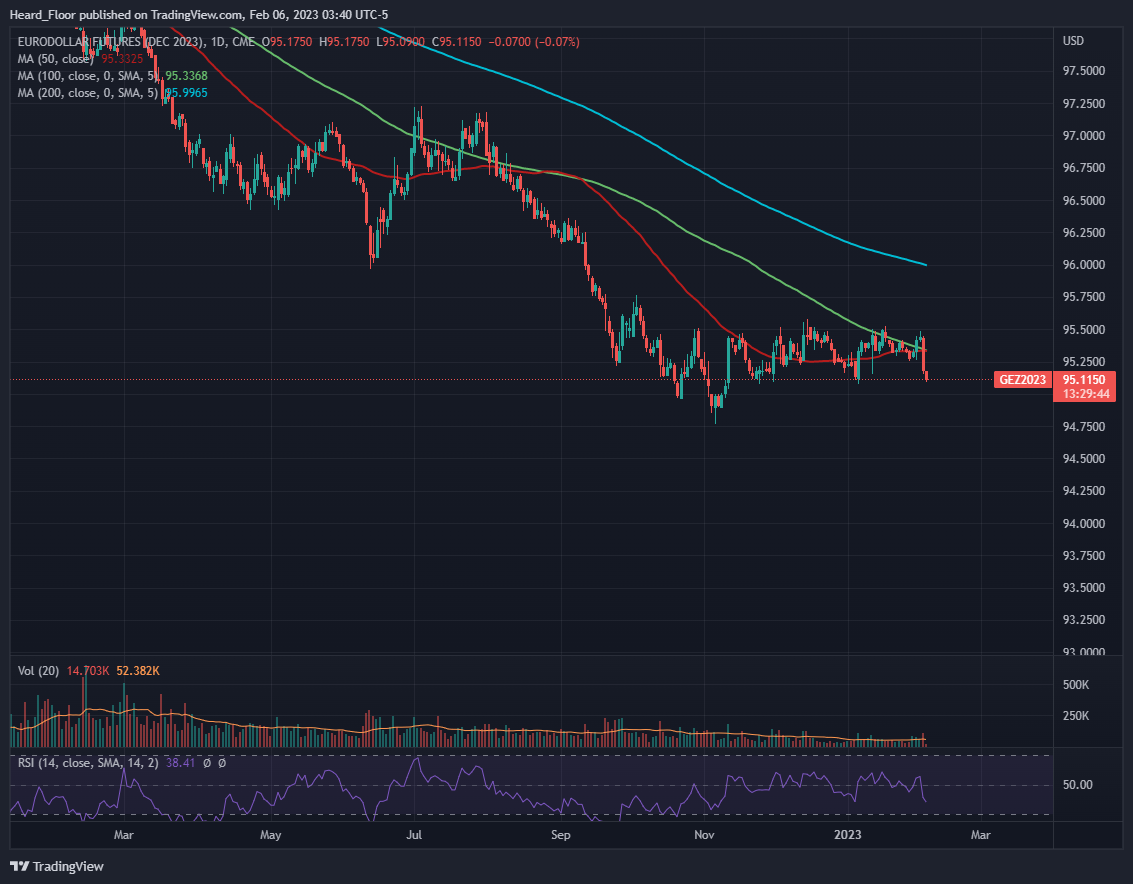
We finally get some sense in the stocks-bond-dollar relationships where I have been pounding the table that something should give in - mainly either rates up or stocks down, initially. Naturally, the dollar exploded higher, in the face of everyone being short. I find it nice that the last two weeks I have been telling you here about GLD and DXY and guess what, even the broken clocked was right this time.
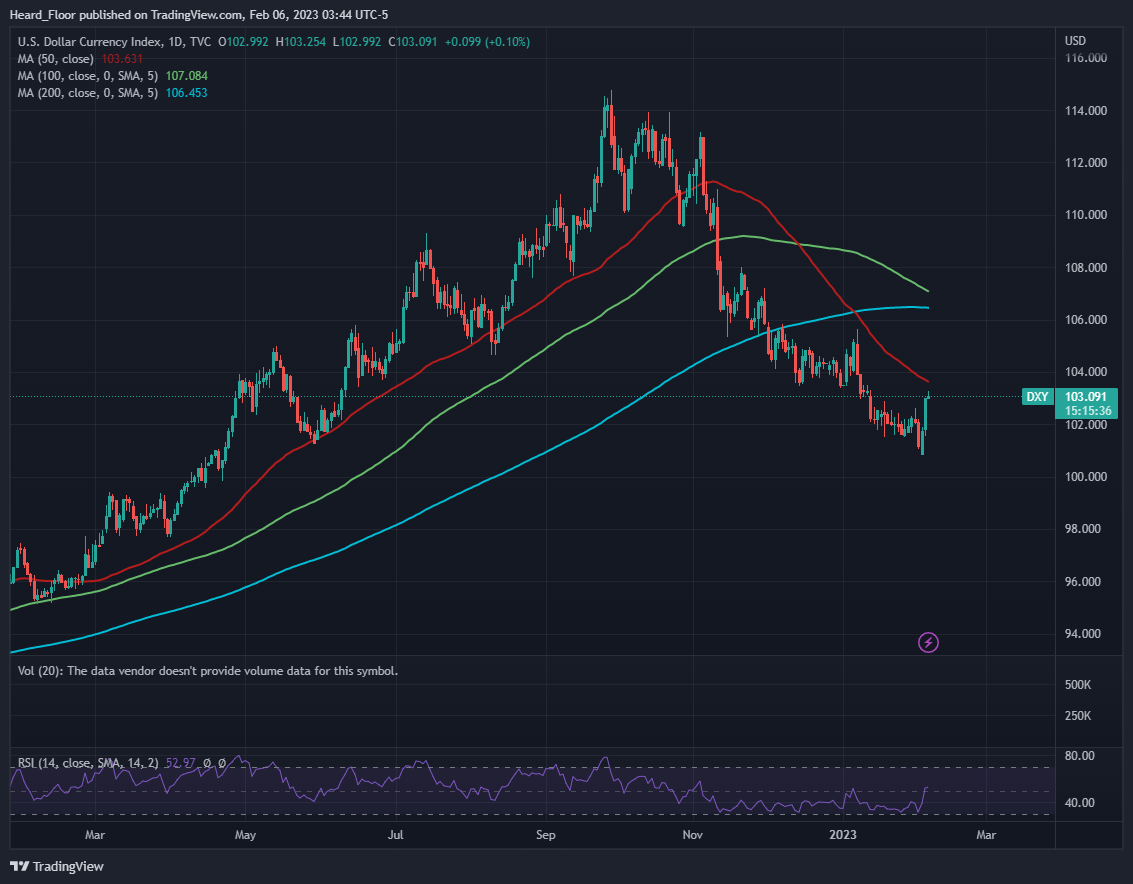
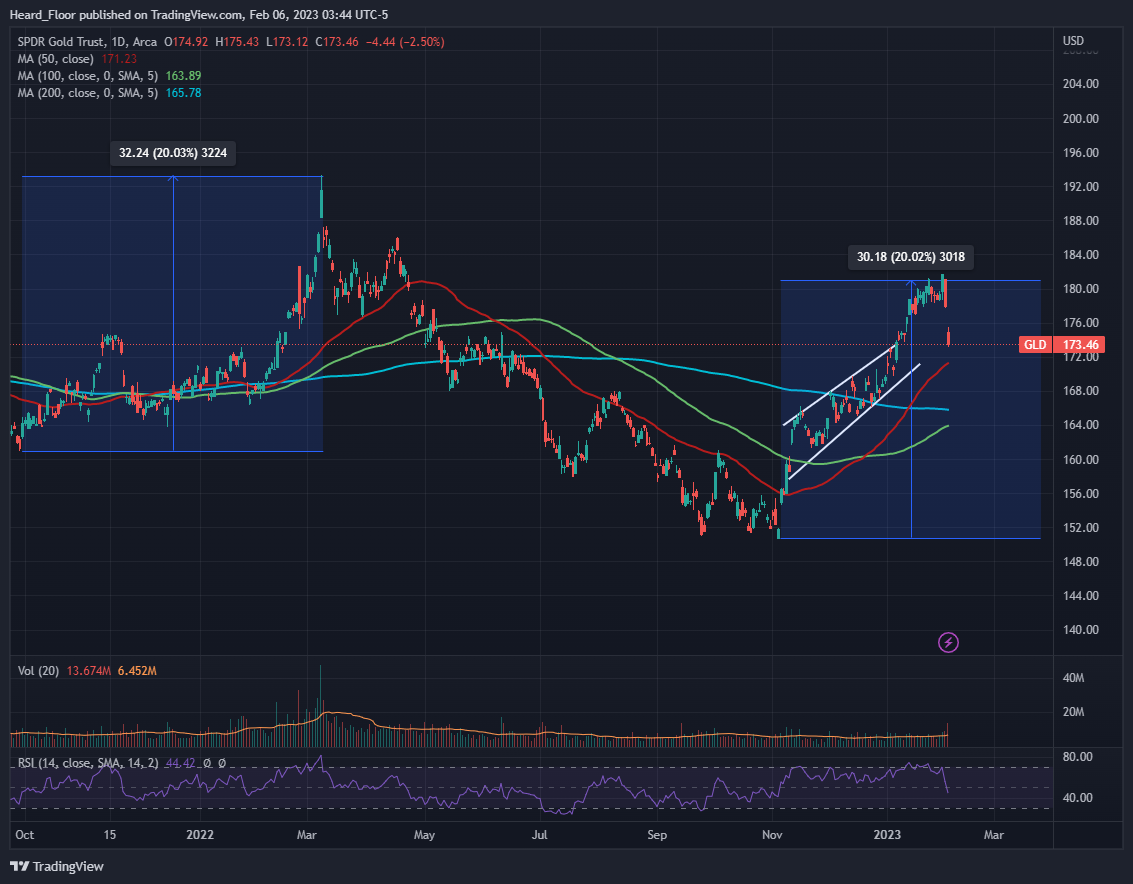
After expressing the driver of my short bias, let’s go fight the recency one. And how does this translate to equities? Equities are a different animal, mainly because it is often about the story and positioning there. What were rather big moves in ED, DXY and rates, turned out to be much less impressive in SPX as I pointed out in this tweet:
SPX barely gave back 1% of the YTD gains amid what someone would call overextended conditions. This alone is a tell.
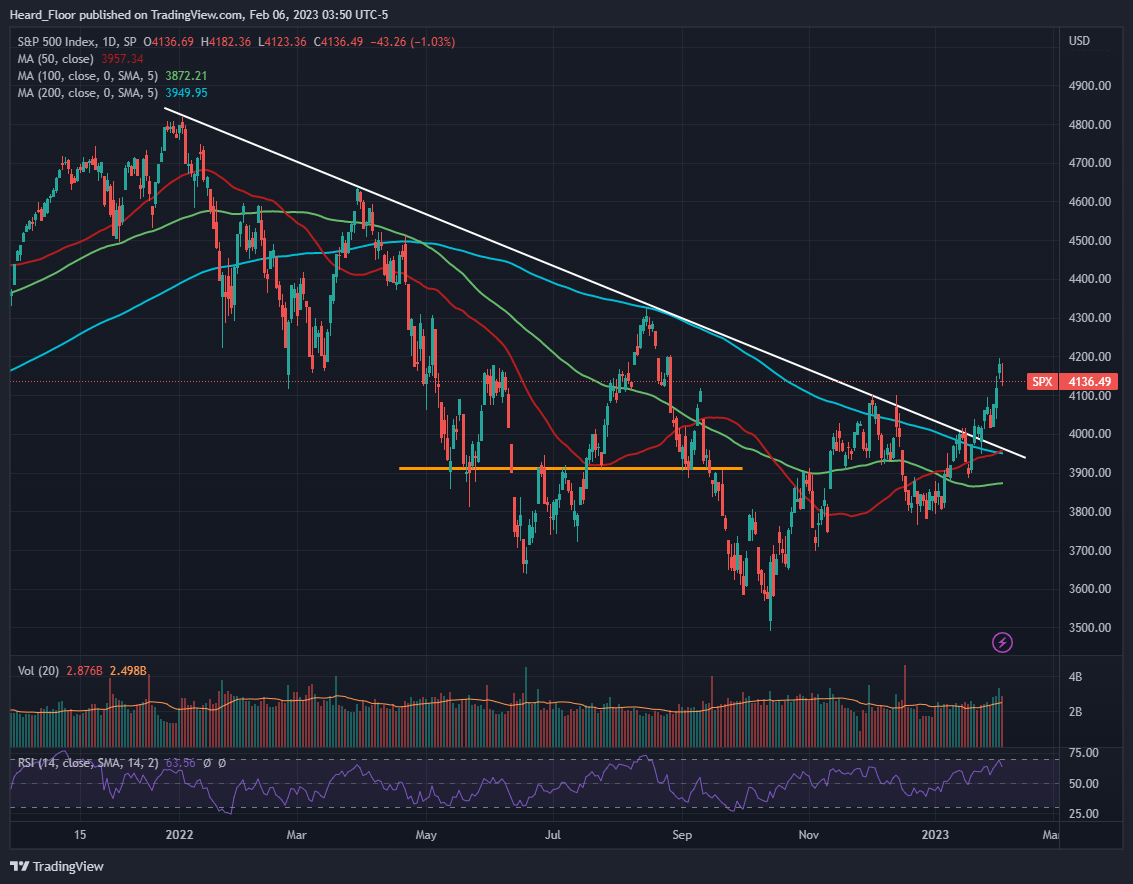
The tide has turned as everyone has noted. The chart certainly looks constructive on the long side and with so many people being left out, there is tons of money sitting around trying to get a decent entry. No matter how I feel and what my bias is, objectively, SPX has been quite tough to bears. No imminent recession, no disastrous earnings and an ambiguous FED with picking up economic have led to low volatility levels and need for increased net longs from market participants. The game has long been played by passive flows and passive indexers and no need to fight that. With support first and 4100 and then at 4000 as of now I do not feel like the shorts needs to be presser hard. I am still fishing for overextension to both sides and the zone in between is where one gets chopped to pieces.
Sector overview and potential trades: What sums up perfectly the behavior in equities since the start of the year is merely a pick up in the most beaten down sectors in 2022. So far, ARKK, XHB, QQQ, SOXX and XRT have had the best run and those were the sectors that took the most heat last year.
On the flip side of that coin are the defensive sectors - utilities, consumer staples, healthcare. The stable and boring risk-off equities that got a good amount of inflows last year have suffered the most in term of relative performance. Energy, being the MVP last year has also joined that crowd.
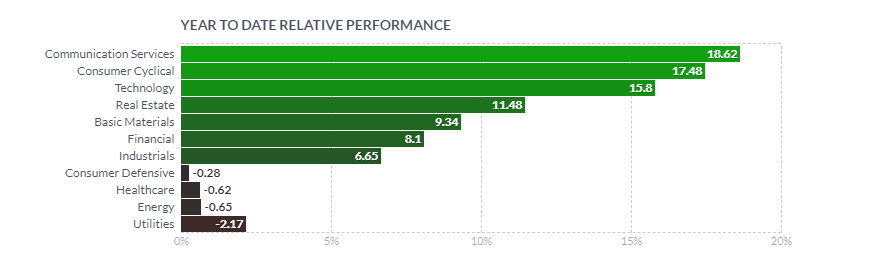
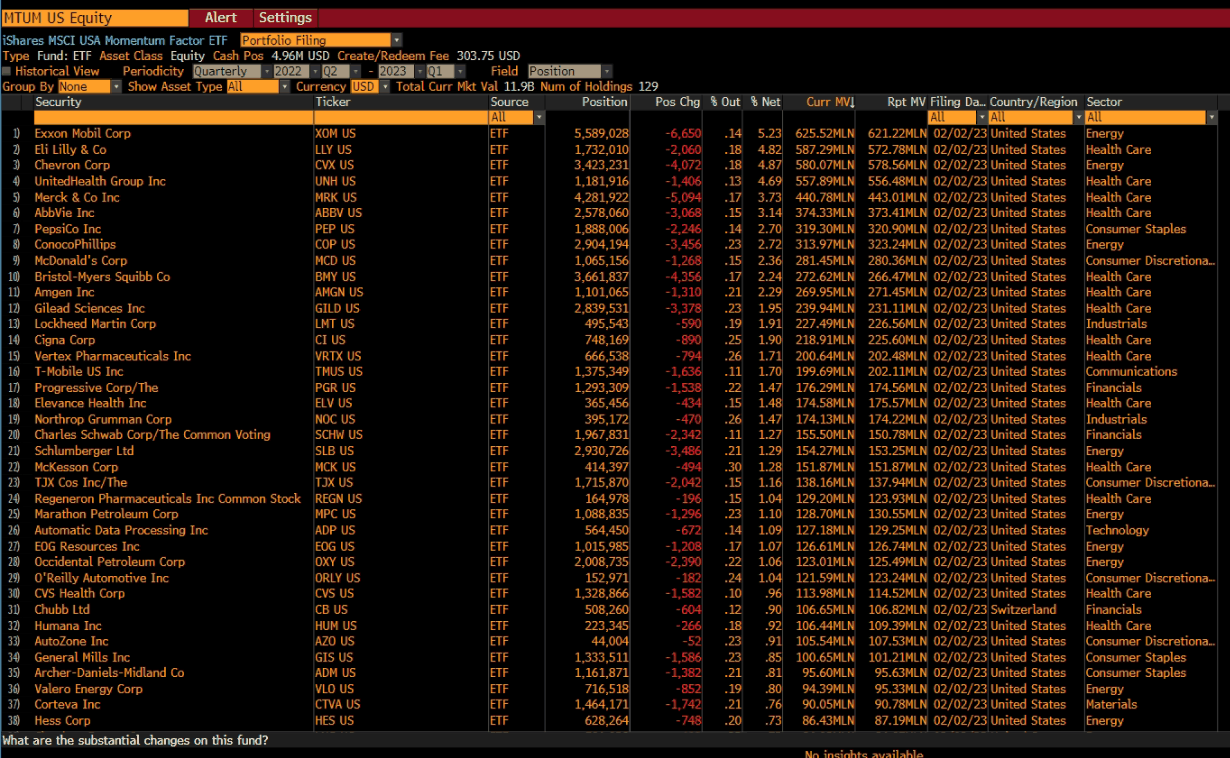
As I was going through some factor returns and saw how appalling the relative performance of the momentum factor has been relative to SPY. Connecting the dots is not so hard, as momentum ought to be filled with stocks that performed well in 2022. A brief look at its composition confirms that - the MTUM ETF is full of energy, healthcare and consumer staples stocks.
A close sibling in terms of performance has been USMV, the low volatility factor ETF. One does not have to be very insightful to assume that the low volatility factor must have tons of consumer staples and healthcare exposure within, but it does not hurt to check it out.
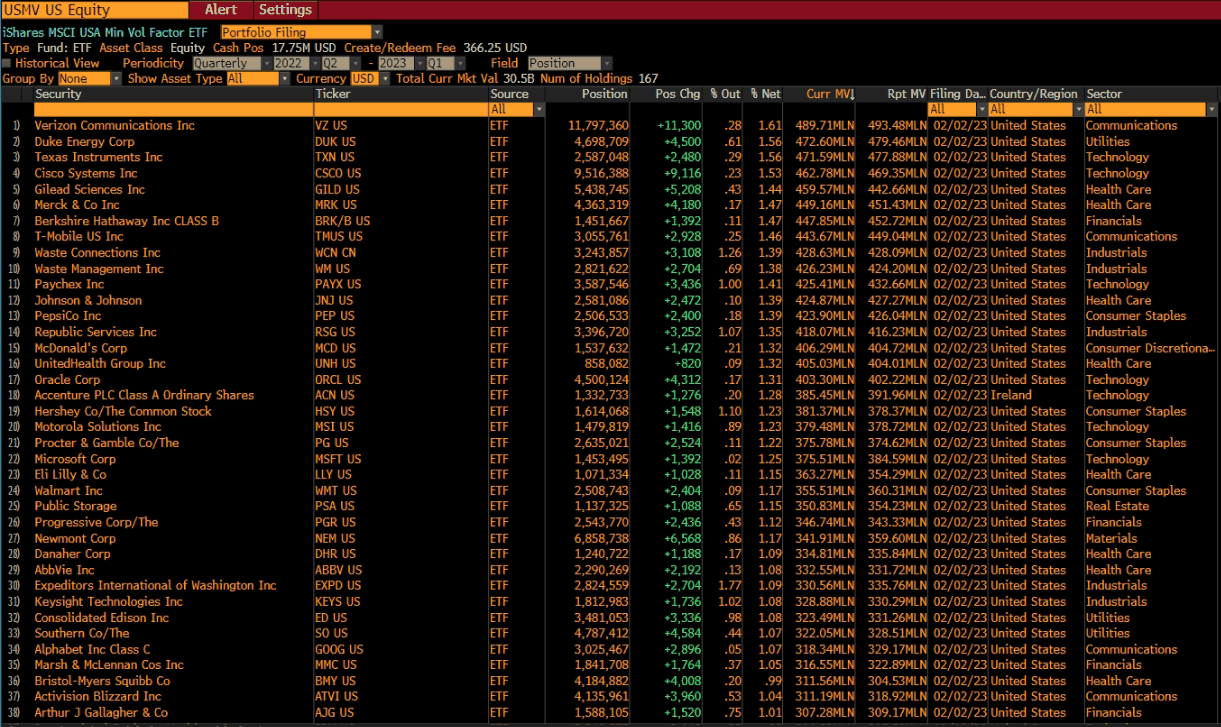
Surprisingly, the USMV looks much more diverse in composition, although it does somewhat confirm the assumption of having XLV and XLP in it.
Despite being dumped for more risky assets, both the MTUM and USMV happen to be on good levels relative to SPY at the moment.
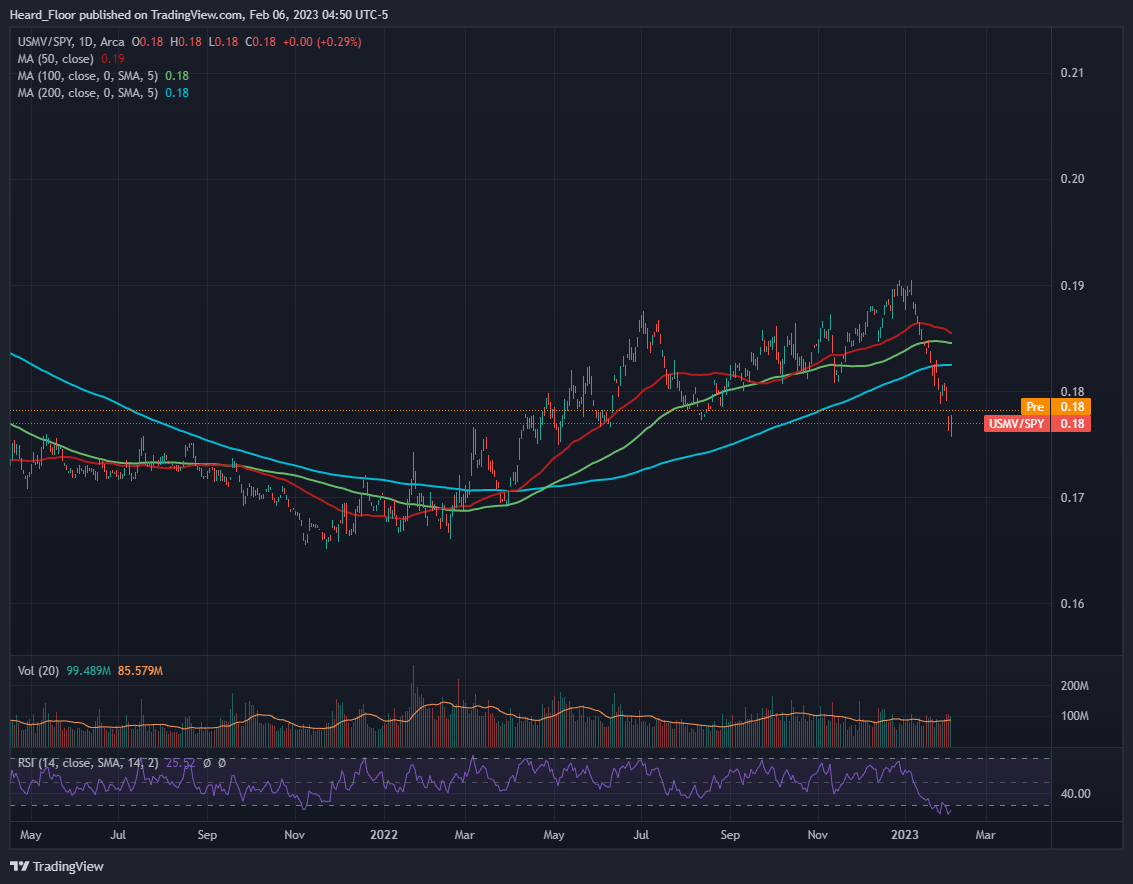
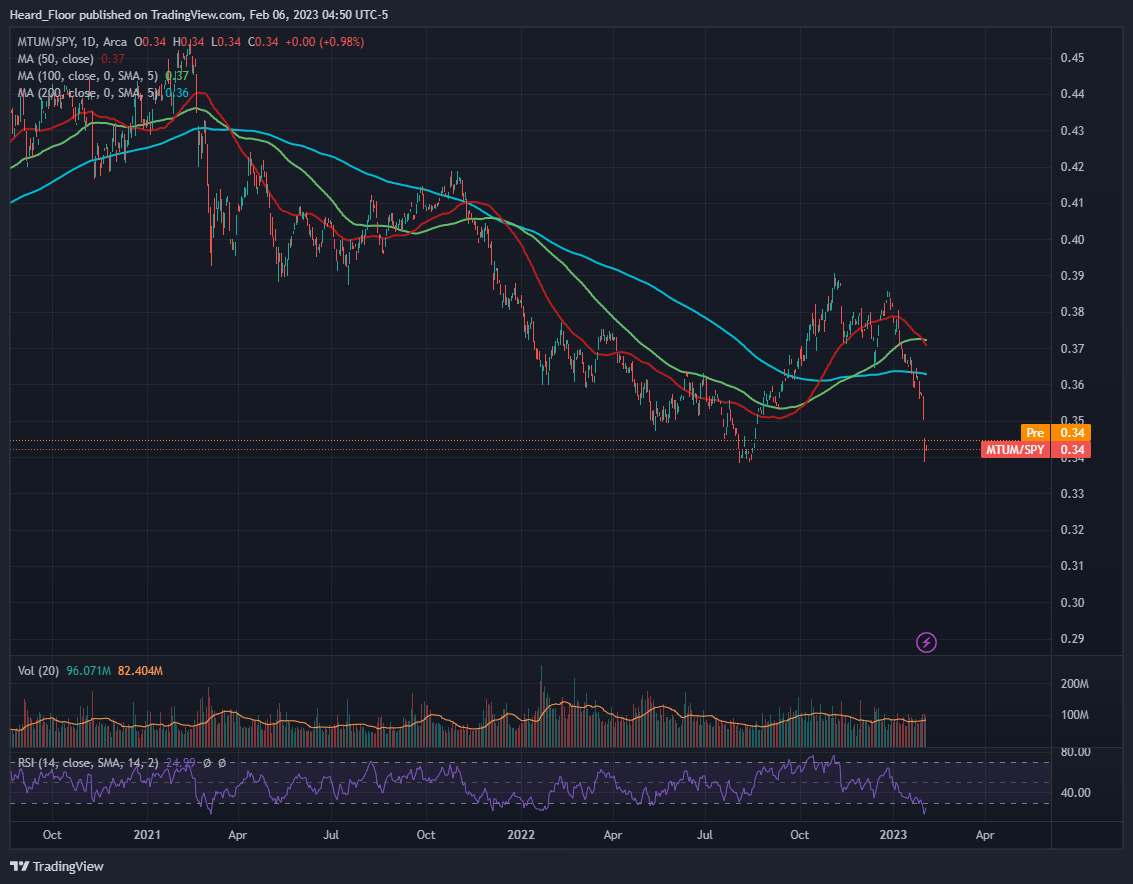
Most of you have probably figured out that I am starting to like the idea of a USMV and MTUM against the SPY. Mean reversion is a pattern I love to trade and having a clear setup chartwise makes it easier for me to structure a trade around it. What is more, there might be some heat around the corner for what has gone so well after what happened on Friday but readers should note that XLU was too, one of the most damaged ETFs that day.
Current positioning: My swing book is currently empty.
The past couple of weeks have been more of a sit and let the change sink in for me and I am glad they were so.
All trades that I have been making for short term in nature and will continue to do so until I see something that I really like. I have a feeling that the idea expressed above will soon be part of the portfolio.
Conclusion: The downtick in SPX has been long due as something had to give in. In this case, it was rates and the priced cuts. As far equities are concerned, they would continue to be bid as most people are out and need to be in so do not get too hyped on the downside potential.
This is OFM Capital’s own research, published for information only. It is not investment advice or an offer of any kind. We may hold positions in the securities mentioned.