
Folding my shorts
First published in Heard on the Trading Floor
Written in December 2022. Prices, yields and positions have changed since.
General overview: Last week I wrote about how people are a bit over their skis with the recent equity rally. I could not have been more wrong about it. I entered last week with solid short exposure (putting risk where my mouth is), given the lullaby from Thanksgiving week was over. Luckily, the drop last Monday gave me a chance to take decent exposure off table before Powell’s speech.
I am an avid supporter of decreasing exposure before speeches and important data releases, as I have found out how tough they are to play. I am as far from a mathematician as one could be, but having a better ‘estimate’ than a bunch of guys with PhDs (1) AND getting market’s response right after release (2) does not leave me with good probabilities, so I try to face such situations with less exposure than usual. This policy is a core to the way I tend to manage risk.
I am telling this because the market melting up after Powell’s “nothing new” was going to kick me hard in sensitive areas, if it was not for this decrease-exposure-into-binary-and-volatile-events principle. As always, risk management is paramount.
There were two things that made a really strong impression on me the past week.
First, I was nothing short of surprised to see that despite Powell not providing new information to anyone following closely, the market rallied as if all the world’s problems got solved gaining 3%+ for the day. Closing above sma200d was the cherry on top of the cake that day, which let to huge MOC orders coming from all sorts of algos.
Second, the developments following the job report on Friday were not less amusing. I am not going to go down the road to discuss how strong the job is or how the market should have reacted to the number. Goldman Sachs was vocal how strong jobs should bring down the indices 2% as “higher for longer” does its thing, yet the market hit the ask and went through the sma200d AGAIN like knife through butter.
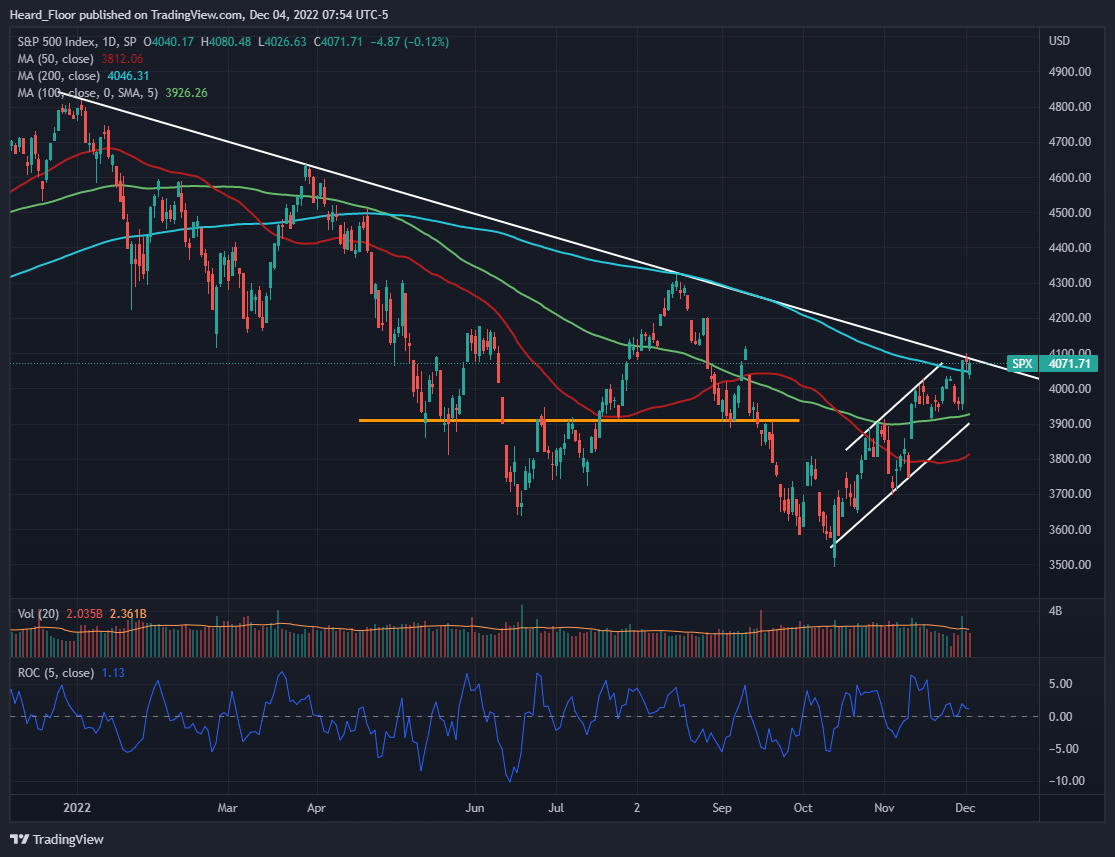
Small caps (IWM) were even stronger, finishing the day on a very green territory.
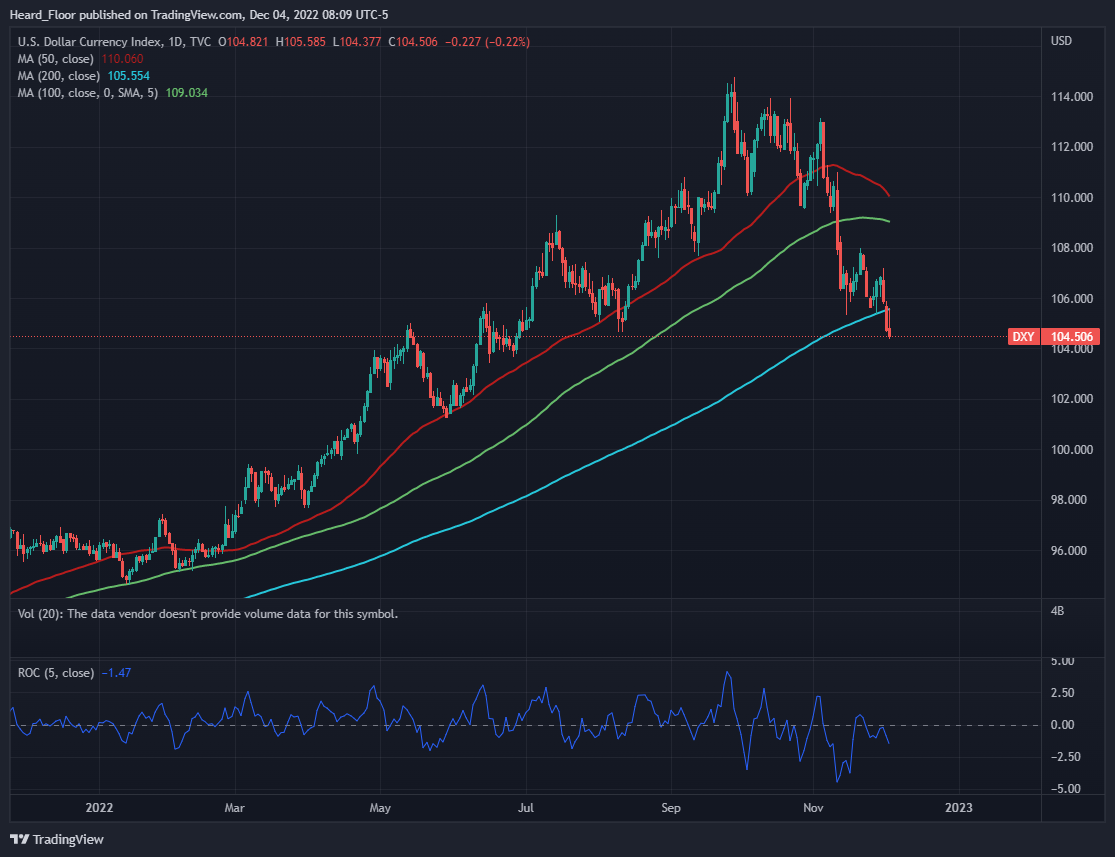
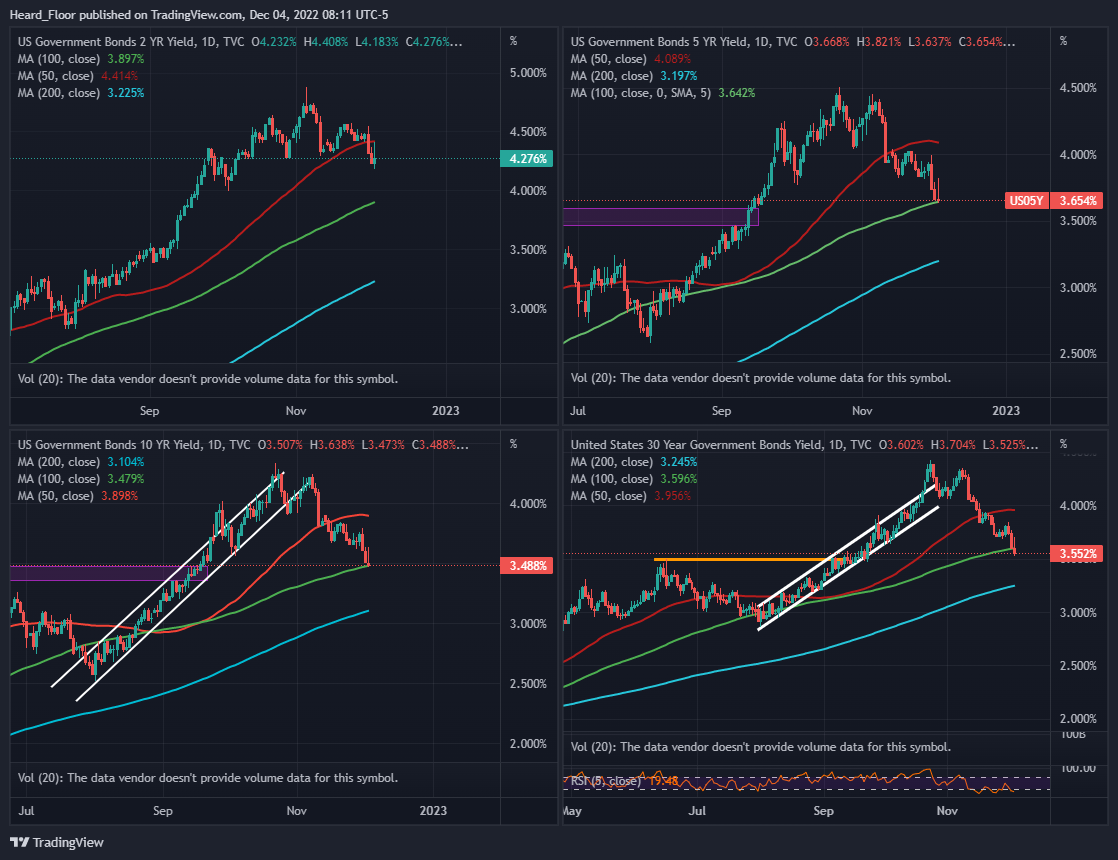
In addition, despite having sold off insanely from their highs and for quite some time now, DXY and the rates did not manage to hold the gains from the data push, making eye opening reversals by the end of the day, despite this being against the narrative of slow growth/recession that has been dominating the long-end lately.
One of the more famous futures trader on twitter (@FuturesTrader71) has a great line, which depicts exactly how I see trading general, but because I was proved to be wrong in my bias not once, but twice last week, I feel it close to heart now more than I have recently.
And aligning with markets here screams for an abandoning the short side, at least for now. We are in a highly seasonal period in a year that some are desperate for window dressing and long exposure is at the lows.
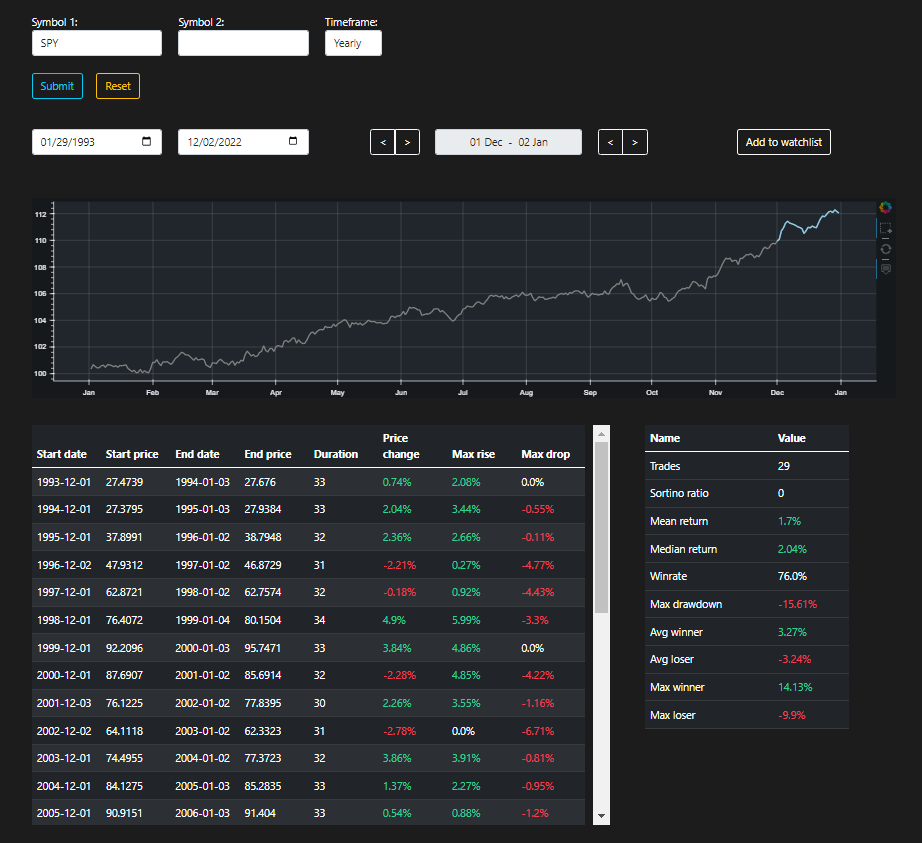
I will go even further, but advice everyone to take this with a huge grain of salt. I am NOT goning to trade according to this feeling either, but I had a weird Deja-vu. It is really strange how we traders operate, but the intuition/gut feel comes exactly like a word that is on top of your tongue yet you cannot remember it to say it out loud. Yet, you know it, it is just somewhere deep until it comes to you suddenly with an a-ha moment. So, I had my ‘a-ha’ moment on Friday. The last time there was such polarity in views, such strong bidding and so many people being caught on the offside was…summer of 2020. I know it sounds ridiculous, this is what I said to me too. And then, on Saturday, I stumbled upon this:
This should not come as bashing the author of the article (@leadlagreport). I am sure he is good at what he does and, more importantly, we constantly get it wrong. I am just pointing out that the people who found it hard to be flexible in how they viewed the market back in mid 2020 are finding it now again.
I have 0 idea what 2023 will bring and I promise to myself to stay open minded. I am aligning myself to the market now, as this is how my style of trading thrives. Until year end, I see no reason to be short biased. This does not mean that I would not trade on the short side, I am just putting the short bias in the closet for now.
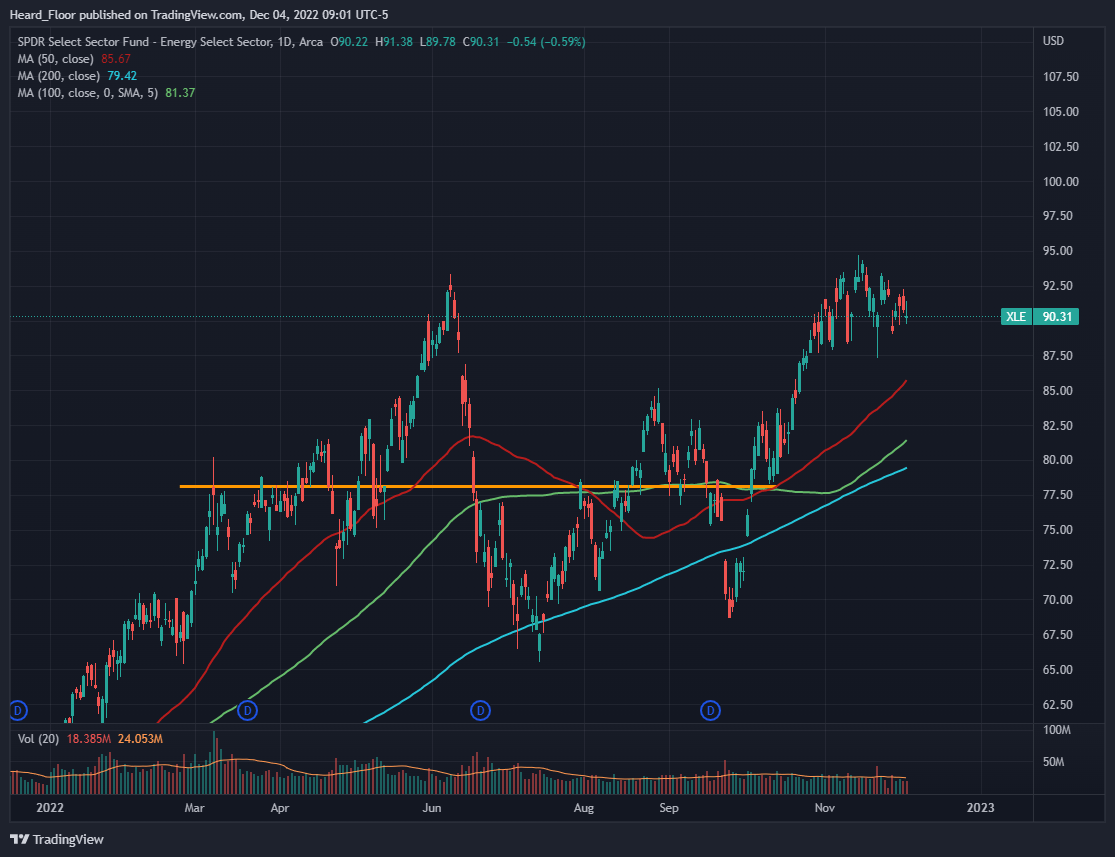
Sector overview and potential trades: On the sector side, this week I will keep it succinct. Everything is a servant to the general force upward with some mild exceptions. Energy equities are showing some signs of gravitational pull towards hardly hit commodity prices. Nevertheless, I would not call them weak as they are refusing to meaningfully retrace from a consolidation at the highs.
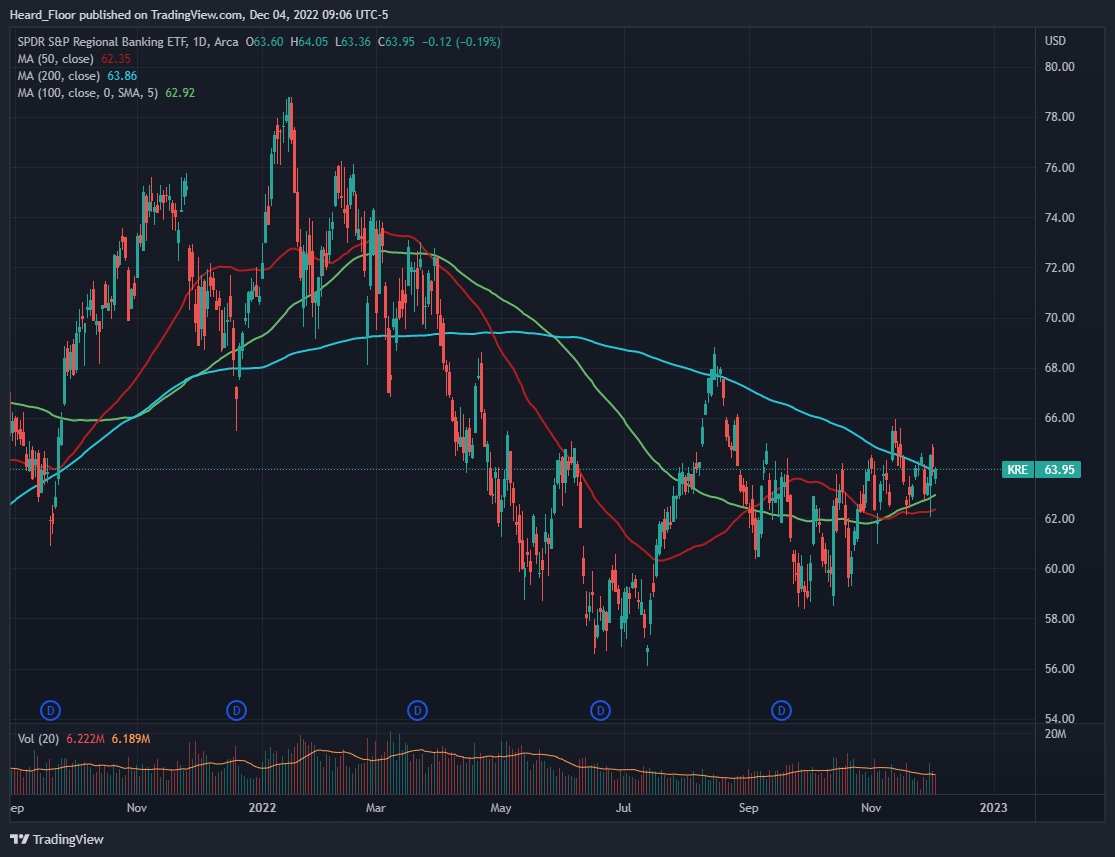
For some reason that I do not know of, the financials and the regional banks are finding it hard to get off. I assume this is because the deep inversion in the yield curve as they now have to pay big money on the short term deposits while harvesting relatively little from longer dated loans having not so impressive credit spreads. The regional banks whose main business line should be net interest income are particularly in the middle of nowhere, even though one might argue that the chart looks like a triangle is being formed, so action should be just around the corner.
In other obscure areas of the market, small biotech stocks have a beautifully looking base, which could have just been broken out.
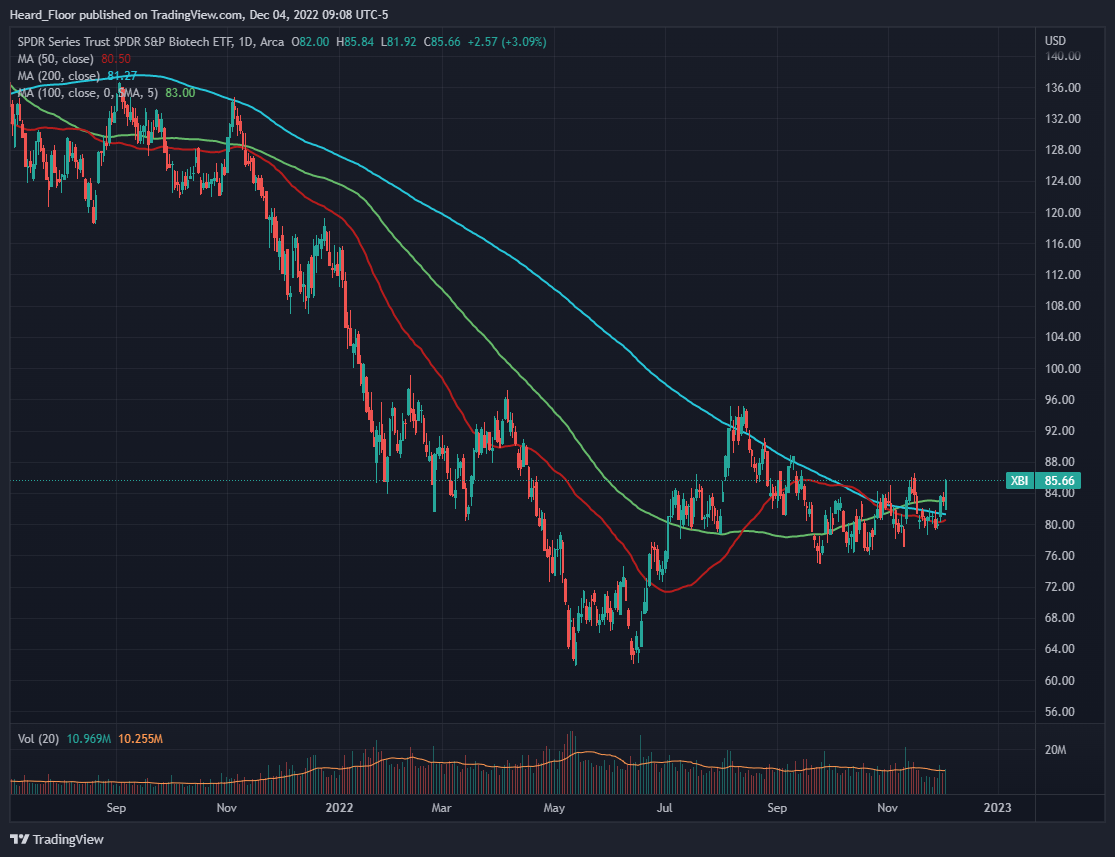
The weekly chart is not less impressive, but getting long this one has a clear stop and easy to build some asymmetry around if one has the sunny hat on.
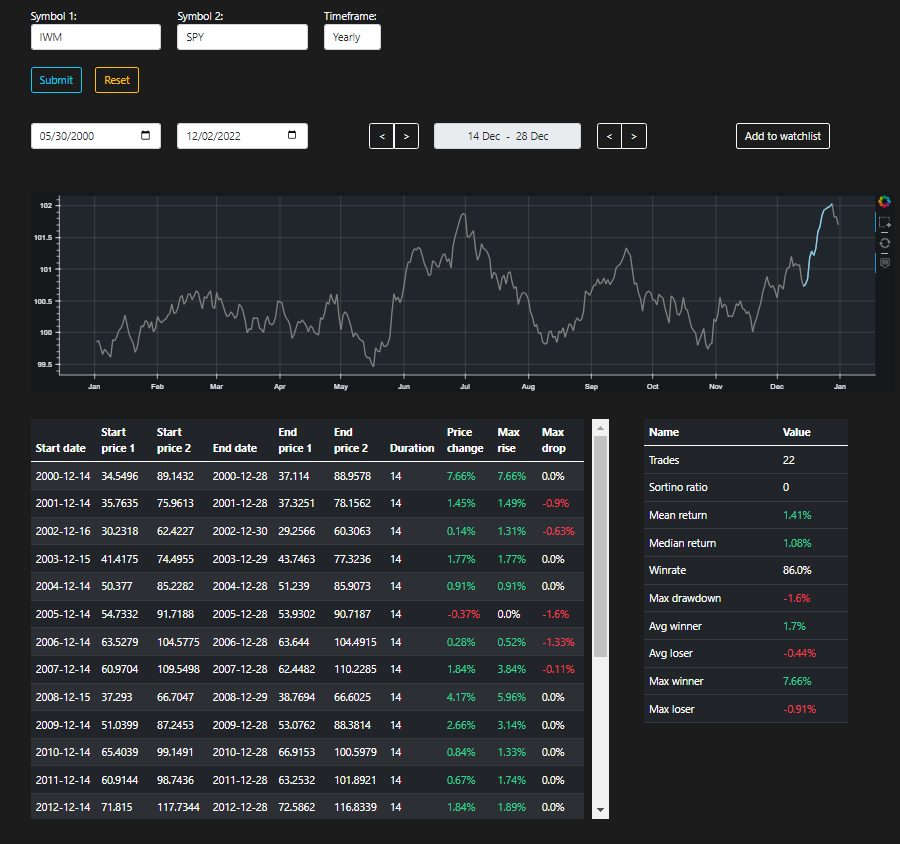
To finish off this section, the trade that I like the most now, but still looking for a decent entry, is long IWM short SPY. Ratio chart looks like being on a good level.
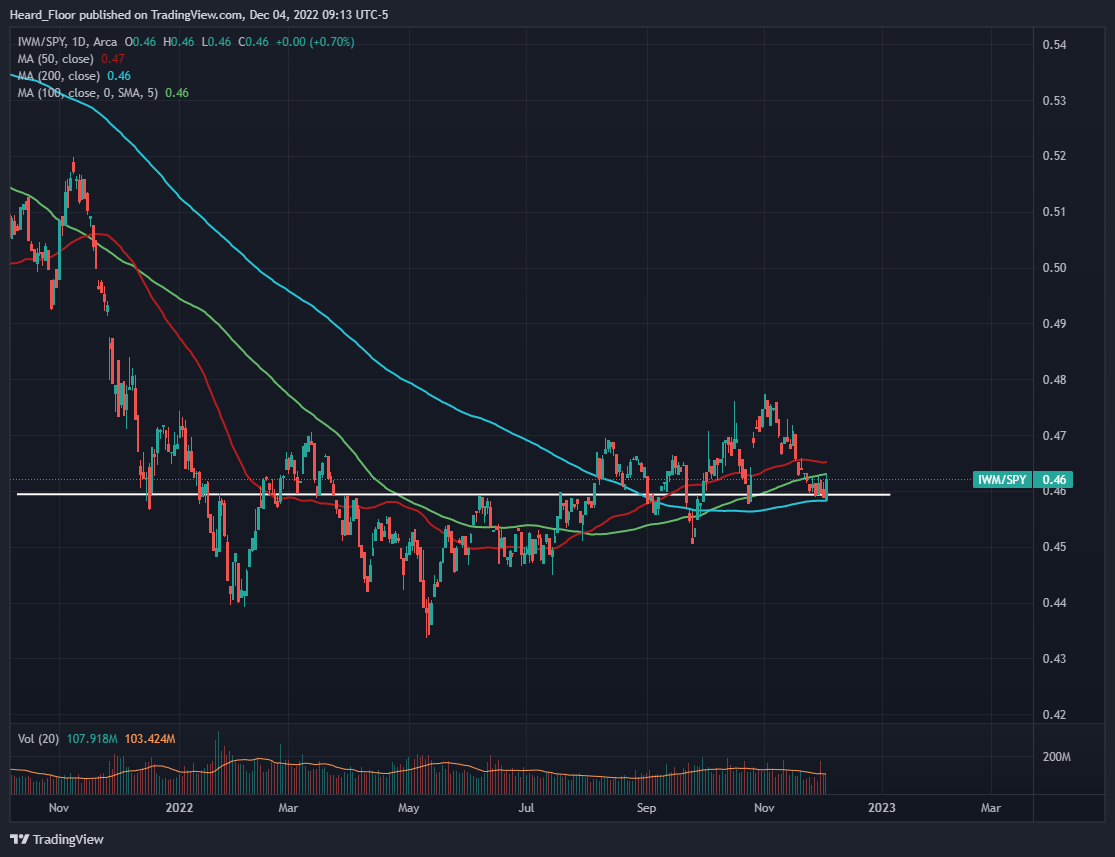
It is a long beta trade one might argue (perhaps correctly) but as we are getting close to the very seasonal year end, I would not mind having it on.
Current positions: I am short IBM (1/4 position) and short PM (half position)
I scrapped all my shorts. As said, all of them were either decreased (DAX, IBM, GS) or totally cut off (XLU) before Powell. After the big run-up I got out of what was rest, including the call spread in CL_F, leaving a bit of IBM.
What is more, mid-week I had long ASHR, short FXI due to nice seasonality and good levels on the chart, but took it on the chin with the last jump from reopening narrative. Glad to have had a wider stop 3%, but it is never nice to have it hit within a day or two.
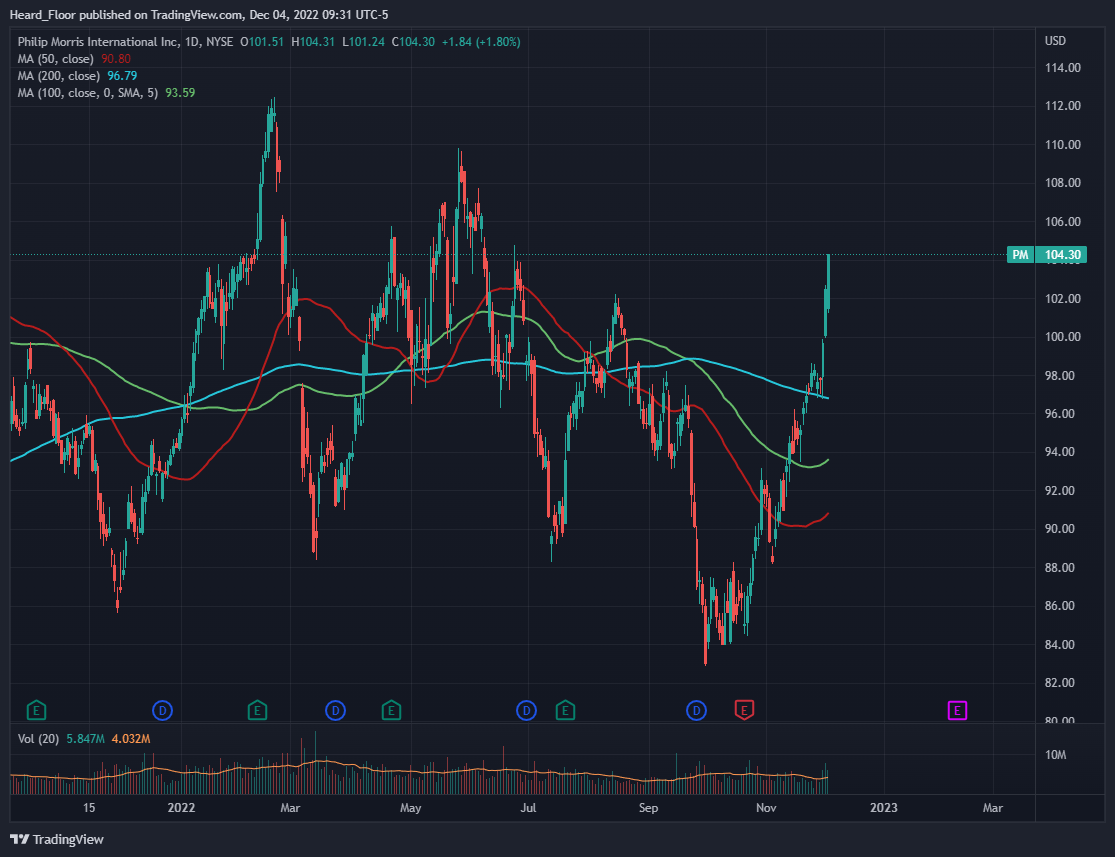
Late on Friday I got short PM purely for some mean reversion, as the sector (XLP) got so extended, it hurts me to watch it on the side lines. I also sold some Dec 9 102 puts for 0.37$ to have some theta burn on my side for the weekend.
Conclusion: I have been surprised not once but twice the past week by how reluctant the market is to go down at this time of the year. I am in the business of aligning myself to the market, not fighting it. Thus, I am postponing any ‘big short’ until I find confirmation for such a move in price action.
This is OFM Capital’s own research, published for information only. It is not investment advice or an offer of any kind. We may hold positions in the securities mentioned.