
Tempted to catch a falling knife
First published in Heard on the Trading Floor
Written in October 2022. Prices, yields and positions have changed since.
General overview: Starting this review comes a bit as a deja-vu. Not only am I feeling that I have been opening the weekly letter with a brief saying about how crazy the last week was in terms of volatility but the overall message that I will convey here is no different that what I wrote last week. So I will keep this one shorter than usual with a brief update following the crazy price action around the CPI on Thursday, thereby expressing my potential trade as a general risk-on tactical trade.
Every day for us traders and investors now seems like being on the (financial) battlefield.

There is no doubt that such feelings are well substantiated by facts. All the stressful daily gyrations are accompanied by the monstrous trend in bonds, which closed on their highs (based on closing prices) on Friday, with a scarily looking bullish candle.
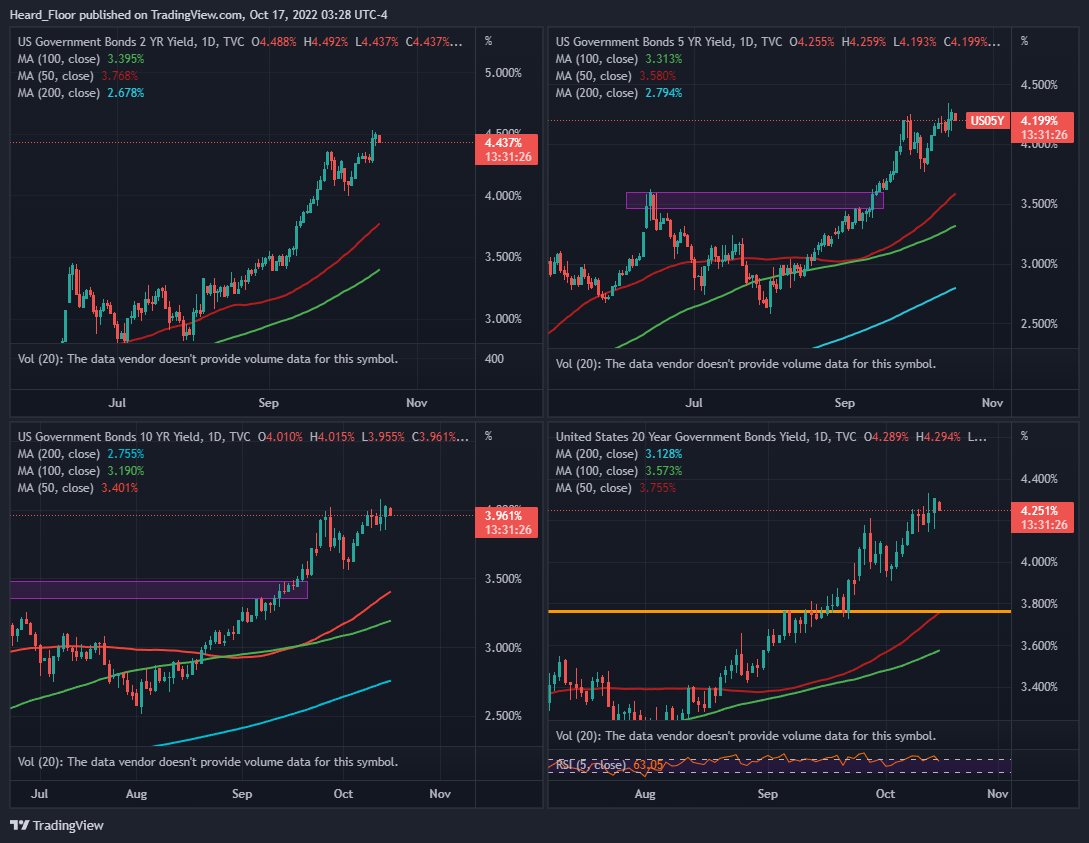
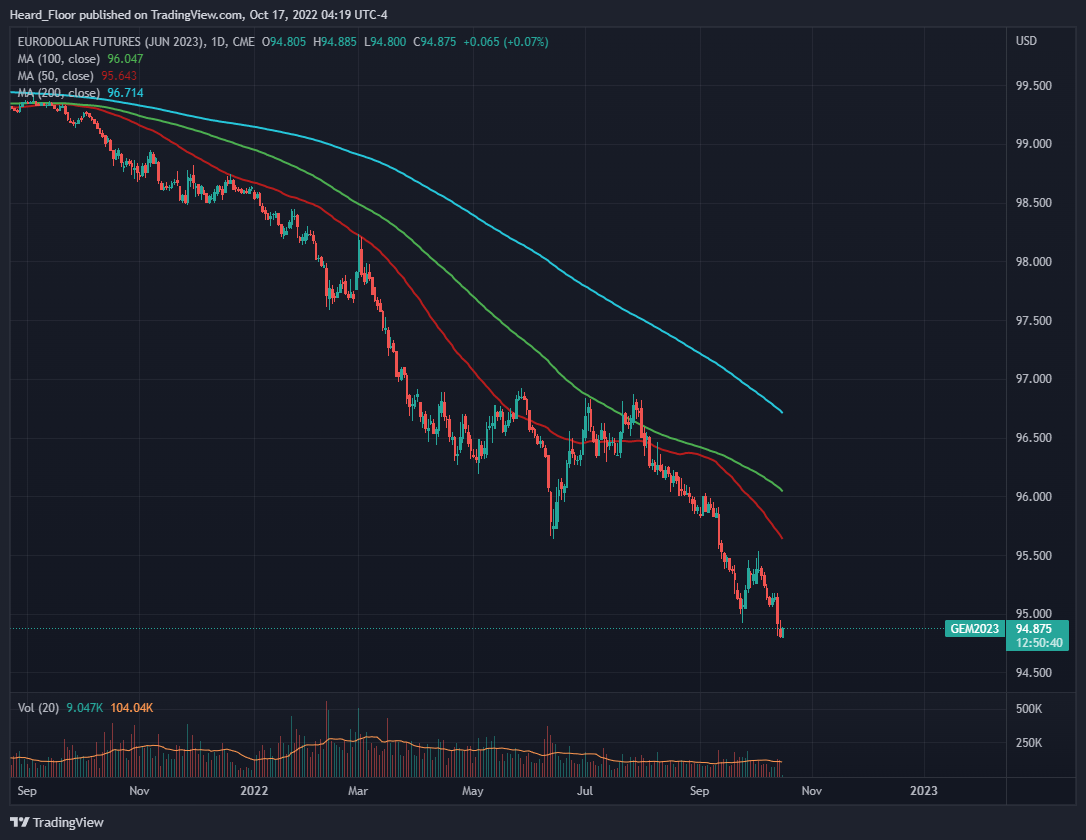
The CPI reaction through the lenses of the Eurodollar market was pretty straightforward, unlike the one in equities. The terminal rate is now 5.2% as per the March 23 contract, which seems a bit too much, given we are currently at 3.25%. People within the industry with deeper connections than me have started whispering that FED is getting increasingly uneasy with market behavior as they tend to follow what the market prices and are desperate for downward CPI and/or employment data to take they foot off the gas pedal.
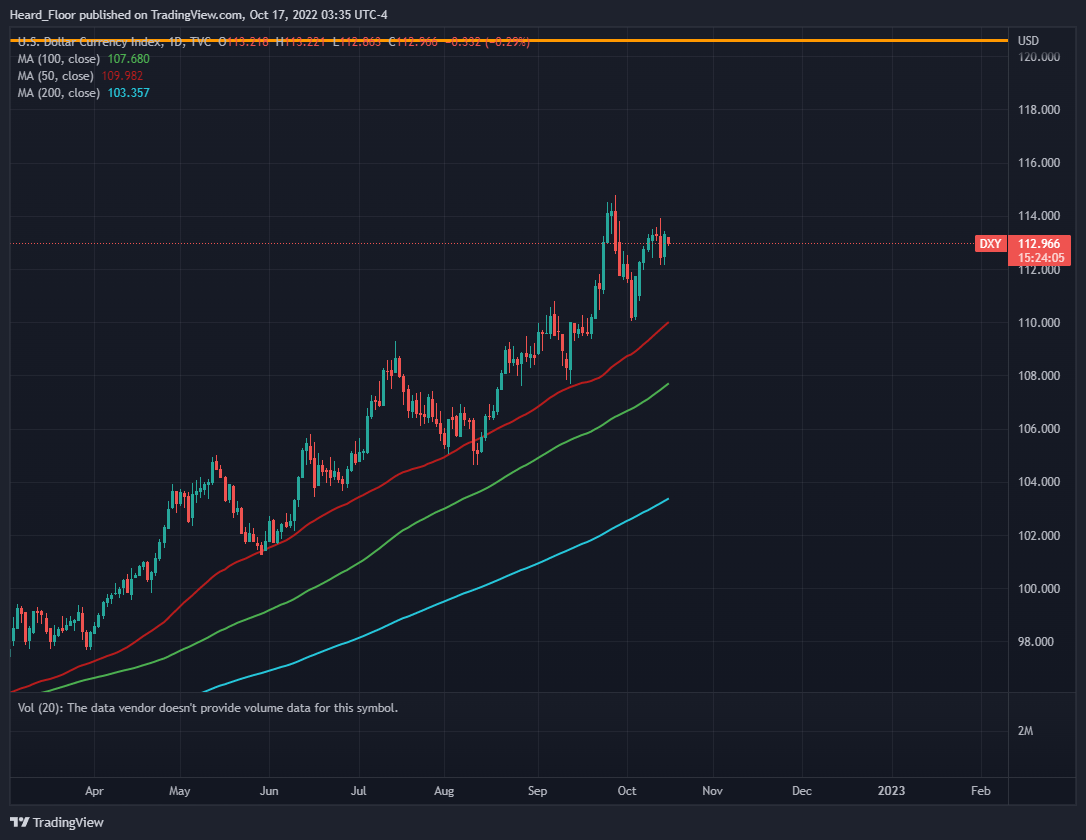
The dollar, on the other hand, as assumed in the last review, has probably topped out the short run. It is already showing signs of bullish exhaustion and the fundamental developments in the UK are finally started to give dollar bulls fewer arguments for being long the dollar.
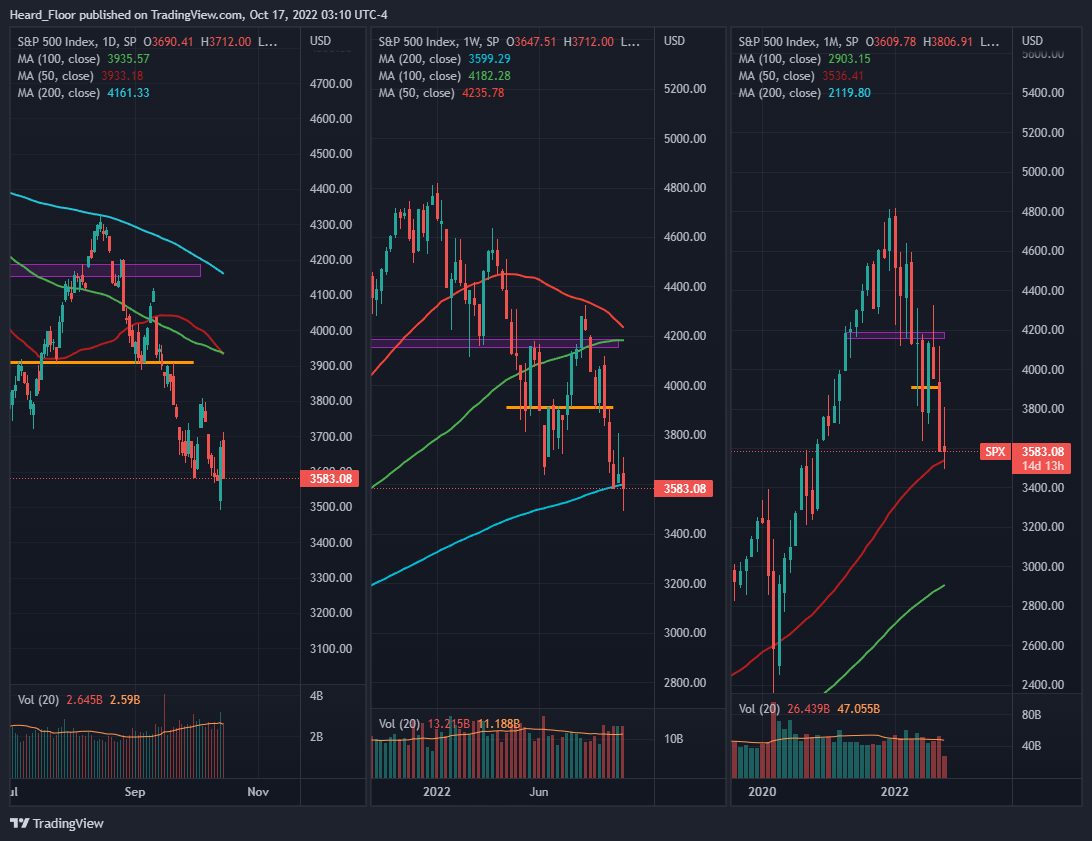
And in equities, the Thursday 5% move easily comes across as an extremely rare event that only happens in ugly times for the stock market. The subsequent 0 continuation on Friday was not less puzzling. Yet, the SPX is just where it was almost a month ago, sitting exactly on the 200 weekly and 50 monthly moving averages, after a huge rejection of the psychological 3500 level.
I am a huge fan of Brent Donnelly (@donnelly_brent) and was glad to see that we share similar views on the market right now. He pulled out some stats following a term he coined D2U2 (down 2% and up 2% in a day), which look like this:
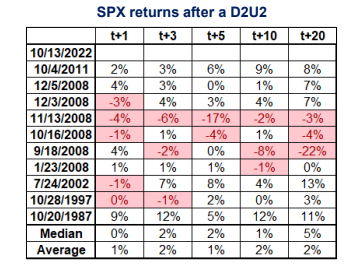
So, on top of giving us a rejection of the 3500 lvl and a nice wick with a low around which to structure a stop, the price action on Thursday gave us another statistical reason to be bullish mid-term.
Add to this what we discussed last week about bullish seasonality in Q4 and mid-term years, and the case for a tactical long on risk-assets is getting more tempting.
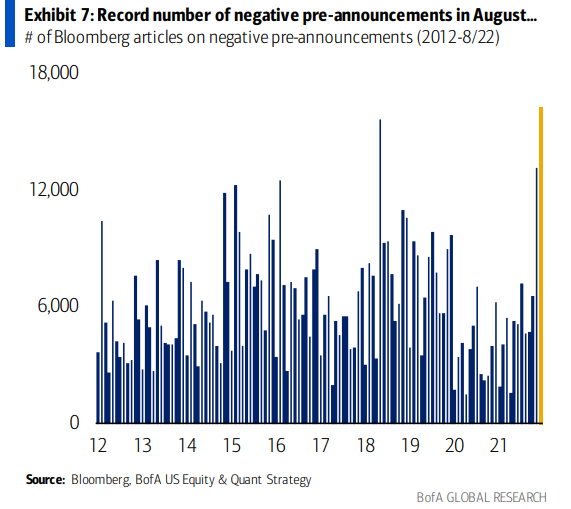
But that is not all. I have also expressed my thoughts that a lot of large companies have already come out with bad guidance or demand news, thus thinking that worse than actual results are being priced in in the short term.
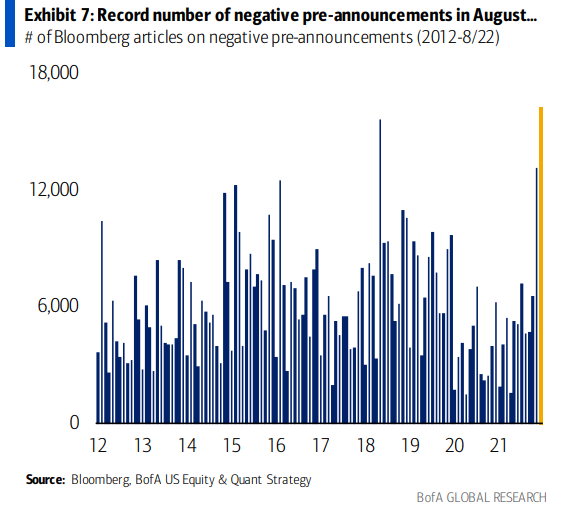
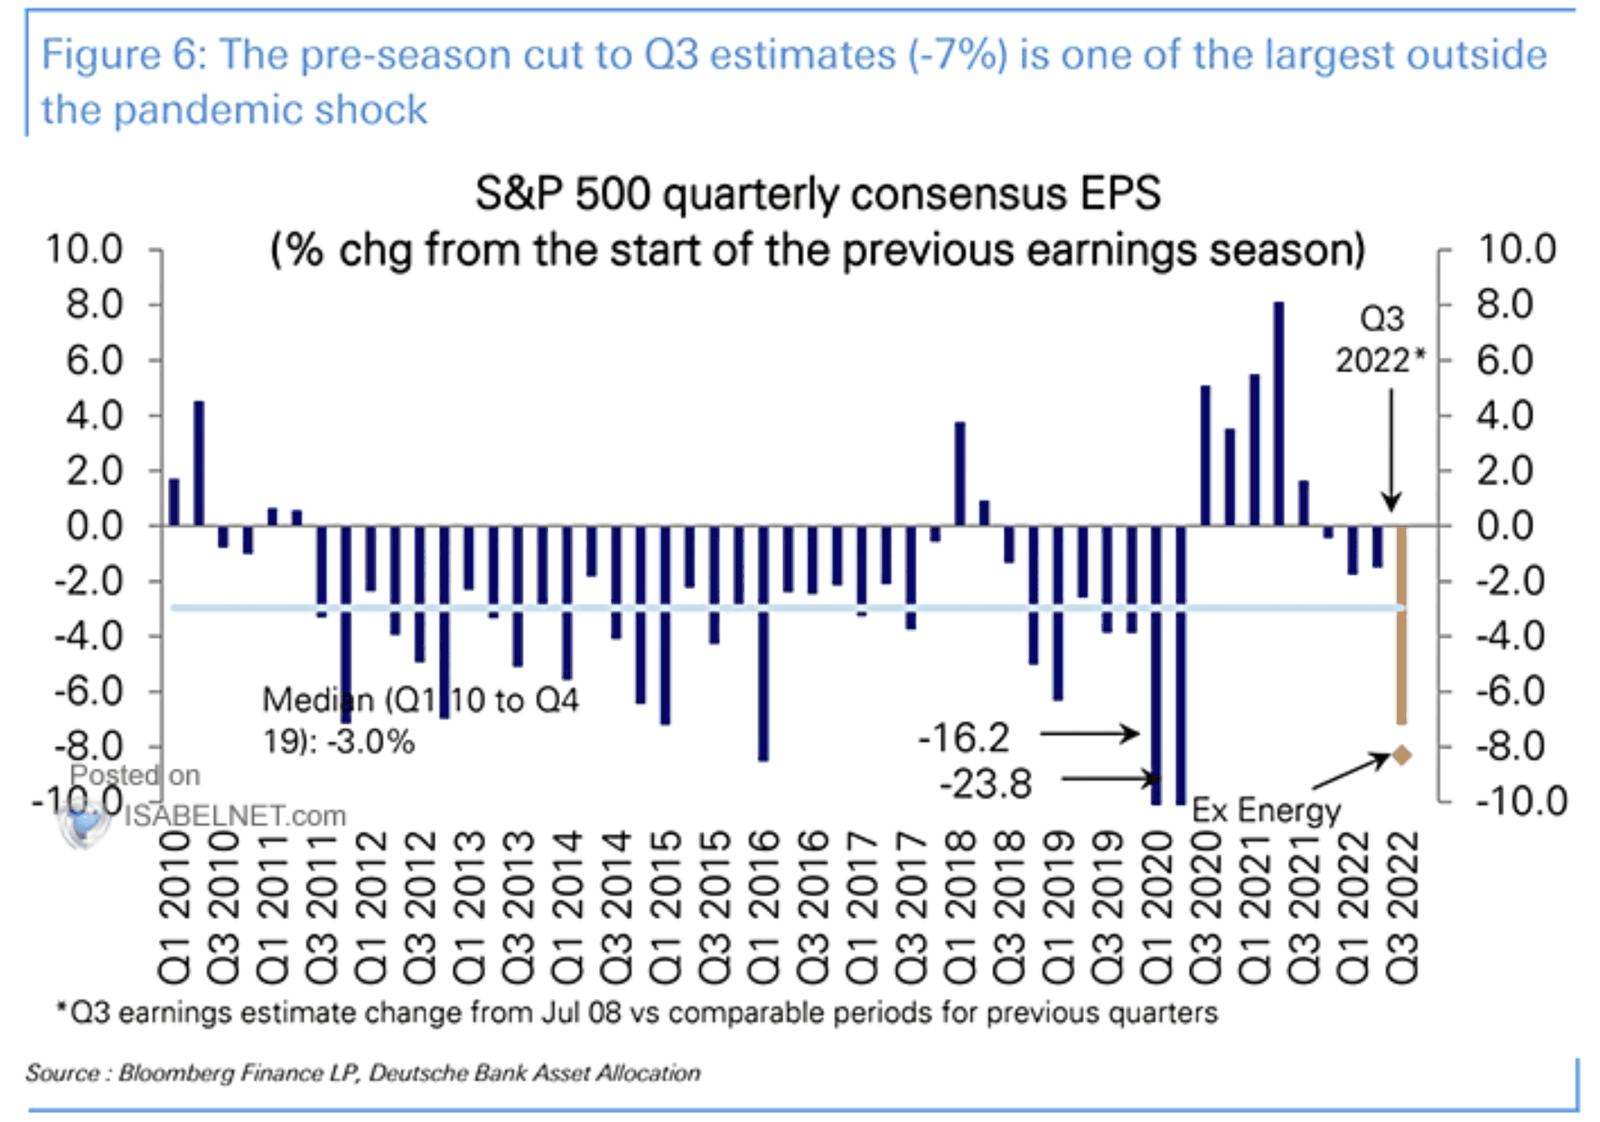
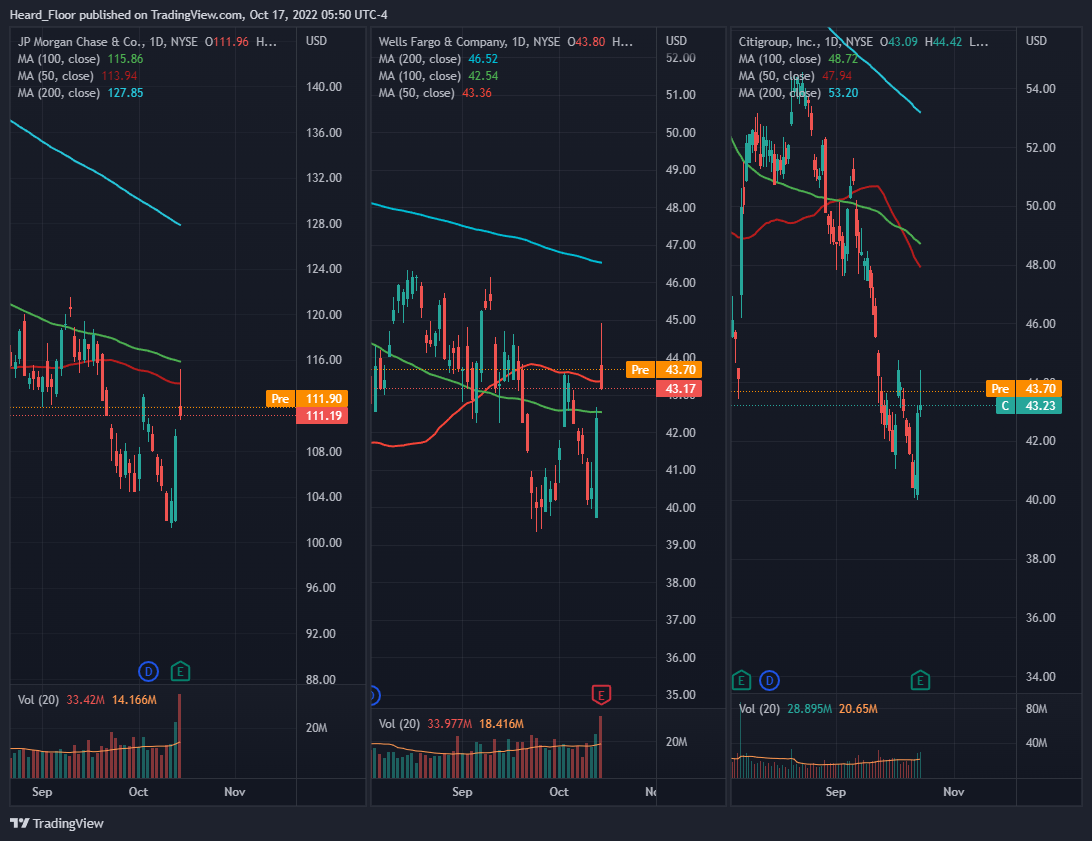
So let’s look at what banks actually revealed last week, as they were the first important players to have earnings announcements.
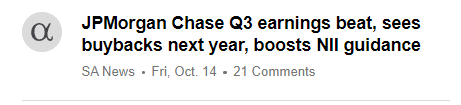
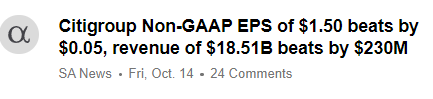
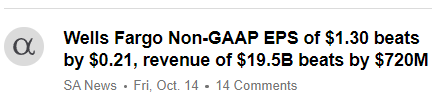
They all beat expectations and closed the day on a positive territory, showing huge relative strength vs the index. I am not convinced the banks will be the only one having positive price action after earnings. Time will tell.
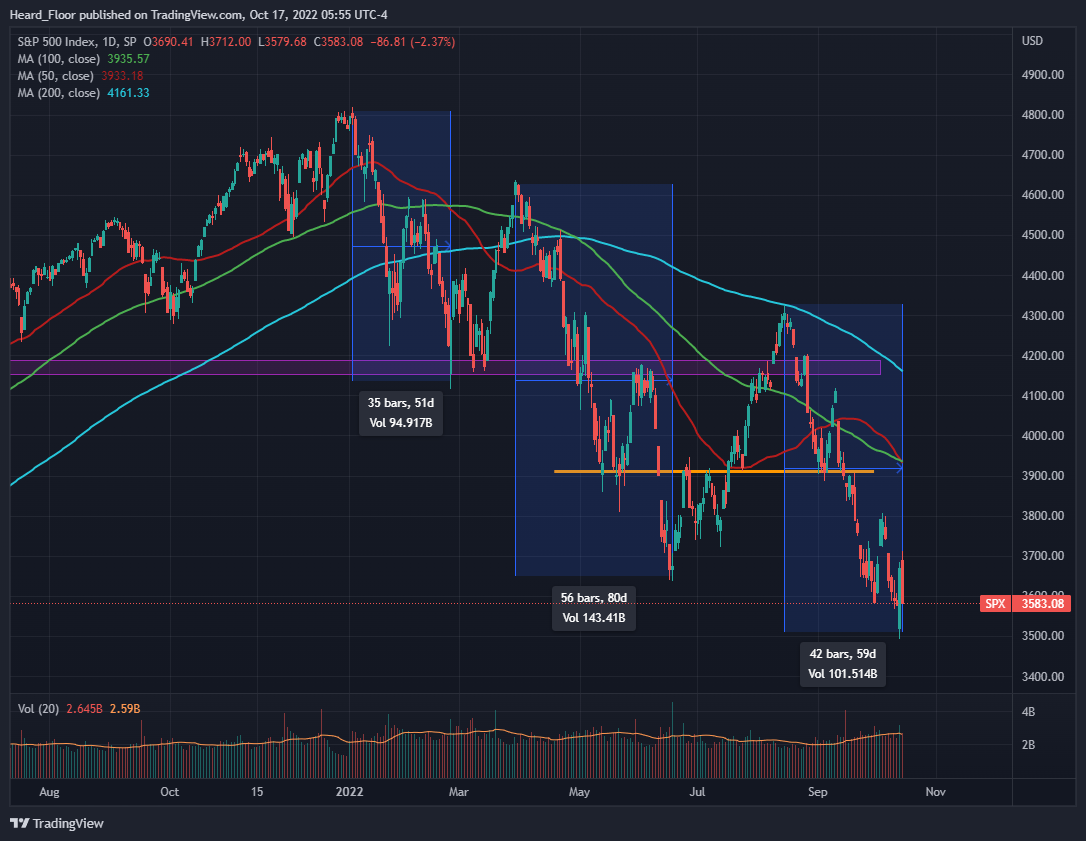
To finish off the short-term bull case, I want to point out that we have been selling for 2 months now, since we kissed the sma200 on the daily timeframe on Aug 16. The previous two legs on the downside - Jan - Feb and Apr - Jun, lasted 51 and 80 days, respectively. Now we are at out 59th day of the third down leg. My gut feels that sellers are about to get really tired here, given the strong support around the technical levels. And positioning is very much to the short side, so squeezing and short covering are all but unexpected (though not with the force they showed on Thursday).
Current positions: I am flat besides the IWM / SPY trade that I put on several weeks ago. It is showing great resilience and I am often tempted to add to it but so far have not done so.
Conclusion: The more I look at the triangulation equities-rates-dollar, the more I get the feeling that the indices are digesting well what is going on. The dollar seems to be forming a lower high, Eurodollar futures for Mar 23 looking oversold and SPX is at key levels with seasonality and statistics screaming for a mid-term bullish scenario. Bad earnings are expected and positioning is still very much short, leaving room for surprises and painful short covering should we go up. This week I plan to add some exposure on the long side. Exact trades will, as usual, be posted on twitter.
This is OFM Capital’s own research, published for information only. It is not investment advice or an offer of any kind. We may hold positions in the securities mentioned.