
Equity and other markets review: 15.08-19.08
First published in Heard on the Trading Floor
Written in August 2022. Prices, yields and positions have changed since.
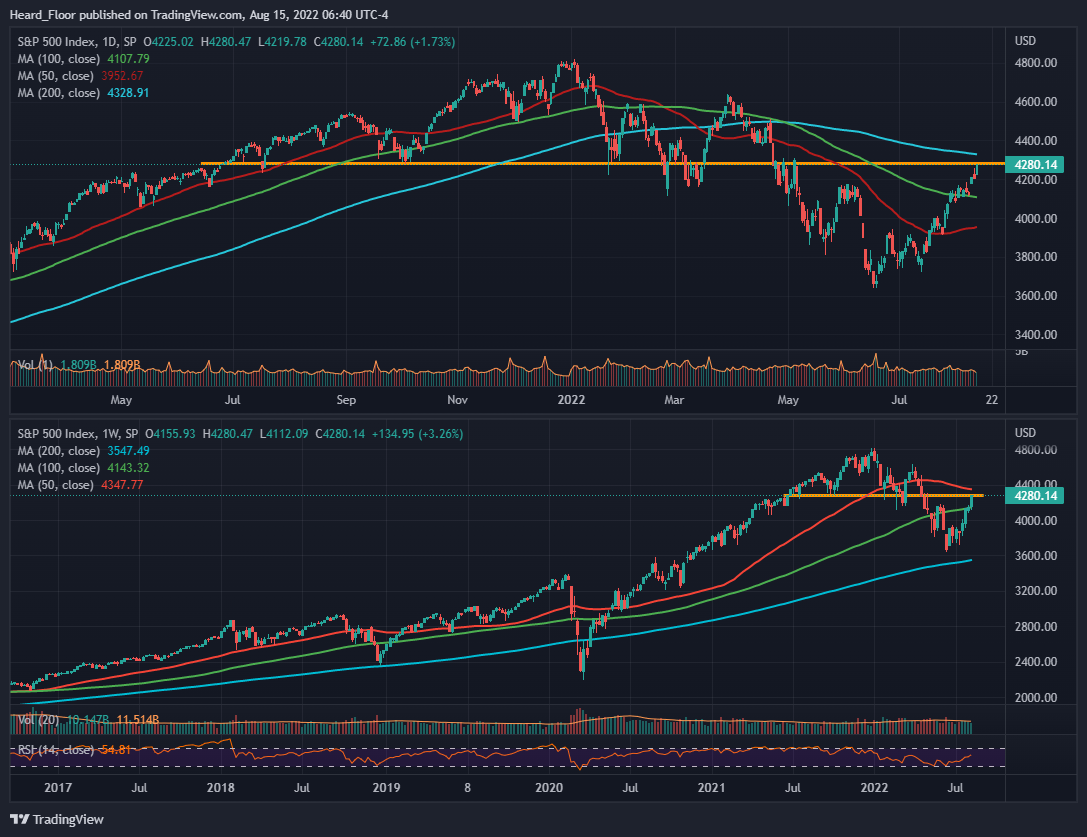
General Market overview: SPX surprised most people on the street last week as it continued to hit the ask with force (up c. 3.3%), fueled by the inflation data, which showed a definite slowdown in prices. It is not surprising for inflation to come off a bit, we all saw what commodities and energy have been doing lately, but the market reaction left me a bit puzzled as I expected the news to be already priced in. We are now a notch off the sma200 on the daily and sma50 on the weekly and I can’t help myself but think that there should be a pullback at least to 4200. Not only that the market feels much overbought, but data shows that a lot of the buying has actually been short covering. That is not atypical for a bottom, it tends to start with a short squeeze/short covering which drives improvement in sentiment and return chasing out of FOMO quickly comes in, but knowing that I do believe smart/large investors do not chase at these levels of extension and wait for better prices, leaving a room for a short-term play on the short side. This week we have housing, jobs and retail data plus the FOMC meetings so stay tuned as those are to bring some volatility. And it is an OPEX week too.
At these levels everyone the market believes the soft landing is definitely possibility and has ditched both recession and inflation as main fears. Lots of folk are left now wondering why the bear market isn’t manifesting, meaning people are caught off-side.
The pocket here 4280-4330 is very good for one to get short the indices
We have a cluster of prior support a 4300, the sma200d is at 4328 and the weekly sma50 is not much further around 4347
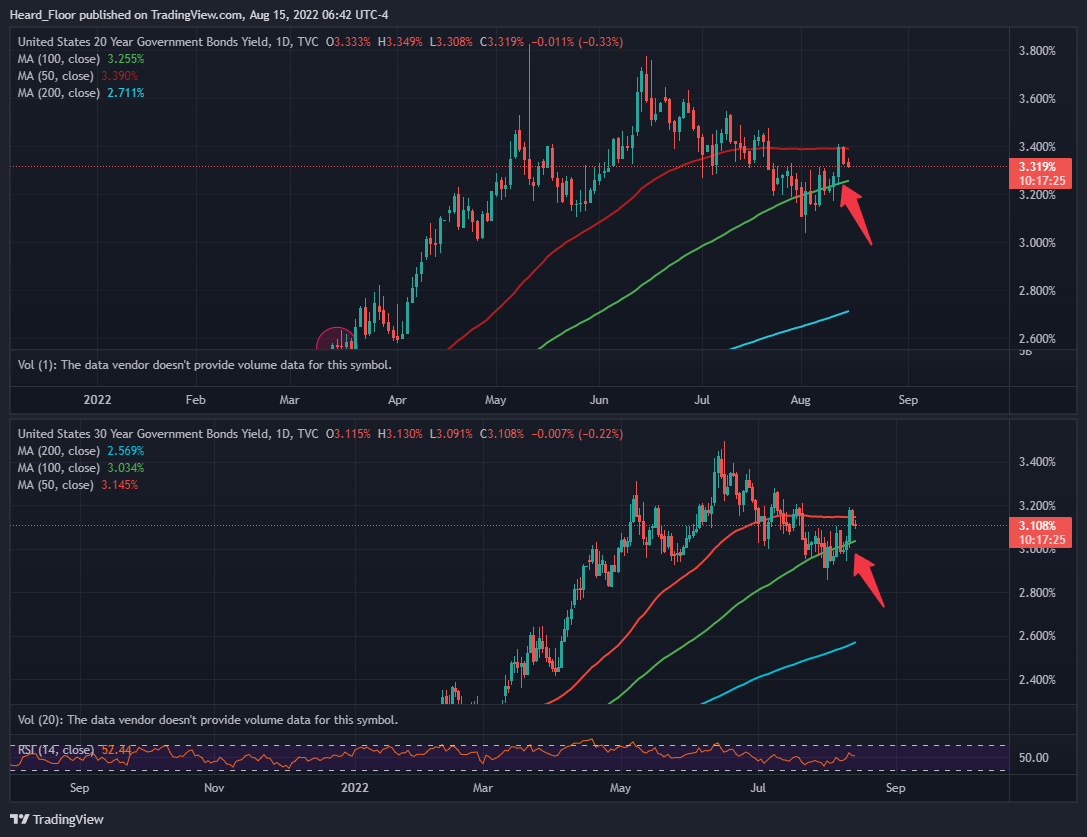
Rates did absolutely nothing based on a weekly candle but it is worth mentioning two things that may have gone under the radar
Despite the inflation data and the subsequent relief rally nothing much changed in treasury rates, whose relationship with the broad market for the last 6 months has been very close
20Y and 30Y rates moved aggressively up on Thursday and they have been creeping up the last 2 weeks. Longest duration assets such as tech stocks should not be cheering about it and $QQQ is to underperform on a relative basis if trend is to continue
While backward looking inflation came out soft, agri futures ($DBA) and natural gas behaved well last week. If oil is to do another rally I wonder how the perception of forthcoming inflation would change
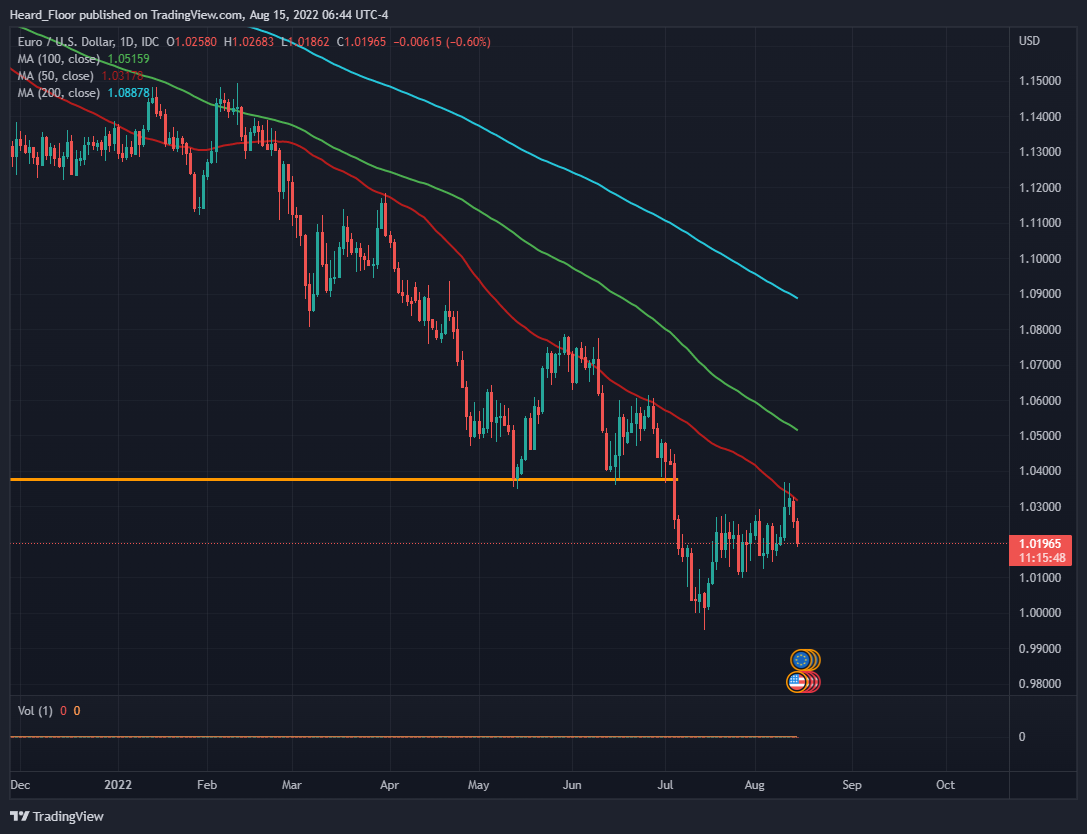
DXY had a hiccup on CPI but the EURUSD retraced from the sma50d. DXY is still strong and stubborn the break the trend
Sector overview – move in equities was so decisive last week that there was no sector in the red. Hard to distinguish under/over performance when there is so much strength coming from risk premium compression
Semis (SOX) advanced the least marking a mere 0.7% gain for the week. It did look bad just before the CPI, with bad news coming from NVDA and MU
XHB continues grinding higher despite having a very bad Tuesday last week. strong and has not reacted yet to the strengthening in rates
XRT market another super strong week finishing c. 6.7% up. Consumer sentiment and demand are not the same thing
XBI consolidating at the sma200d. It looks like broader market strength is failing to show its true effect in the small bio-caps as there has obviously been selling given how many days it spends consolidating lately
MSOS remains the one that has not picked up. Still with a great long-term formed base but I no longer have skin in the game
XLE was the best performing sector last week despite the front oil futures contract marking an unimpressive gain. Betting on energy stocks has been more prudent than owning the commodity itself and would likely remain so. Back end of the curve is much more solid than the front end and more representative when betting on a long term view on the equity proxies
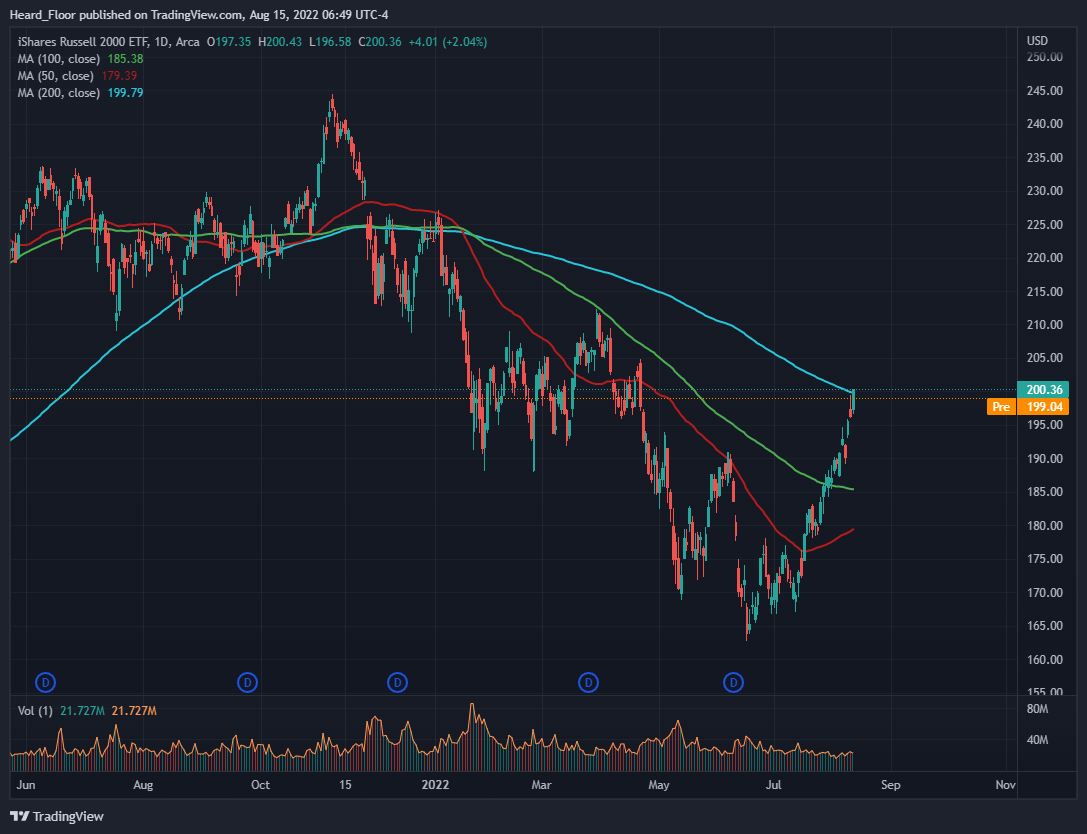
IYT and KRE hitting the daily sma200 and the weekly sma50, overextended as hell. IWM also at the sma200 on the dail
XLU to hit all-time highs soon and nobody is talking about it
BBBY, AMC, GME continued with the insanity last week. Some calmness might be coming as GME finished on the lows, AMC where it opened on last Monday. Signs that the sentiment might have become too optimistic too fast
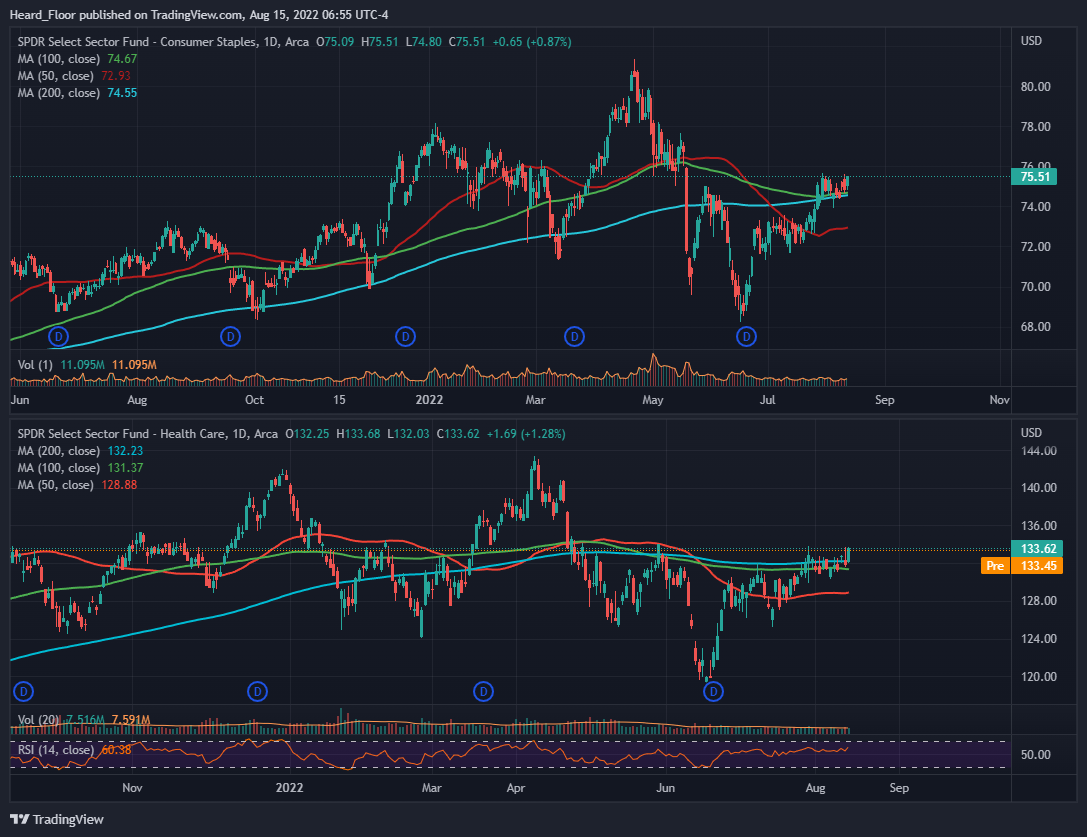
XLP and XLV trying to break out of consolidations on the sma200d
Commodities: Energy and metals steady, agri jumping off the bottom
Oil is dancing around the sma50 on the weekly and sma200 on the daily chart. The downtrend continues as the jump last week was not impressive. However, support I believe is not too far in the 85$ area and one willing to bet on a jump would be much better in the equities, rather than the futures
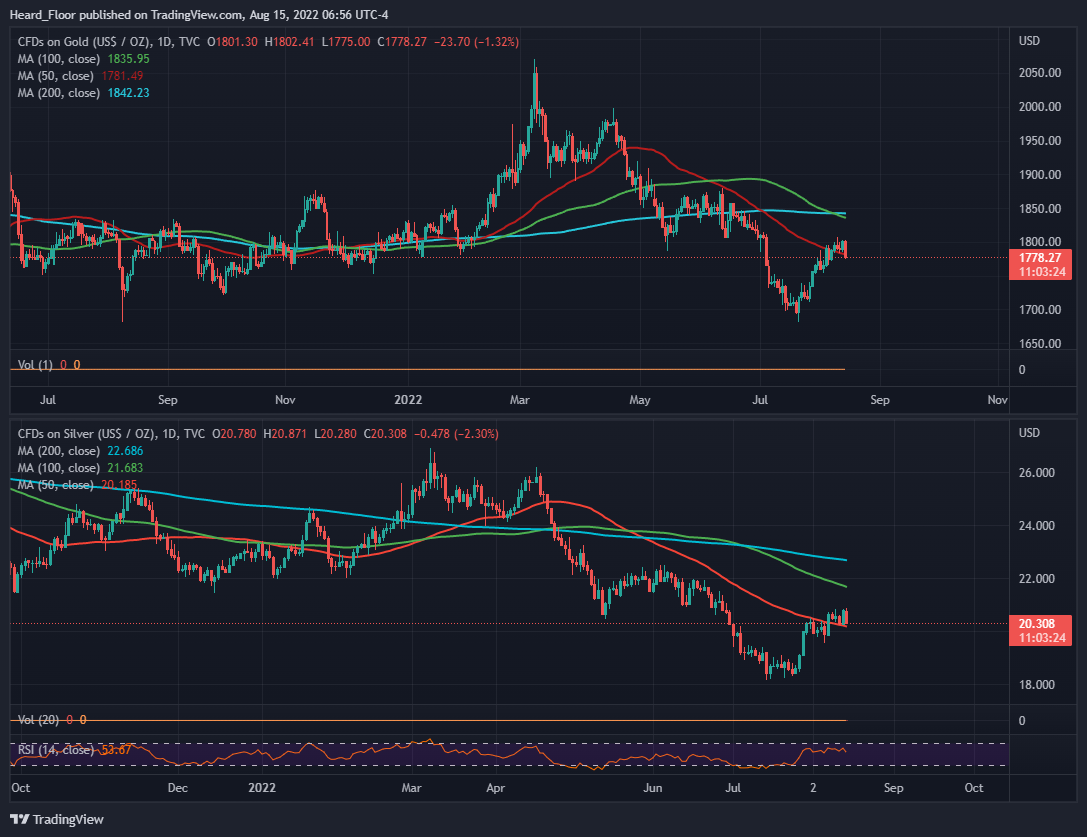
Gold and silver have stalled at key levels around 1800 and 20.5$, respectively. Would rather look for a short than long at this point
Copper reject the sma50 on the daily and bad news from China keep coming out
Currencies: USD showing resilience
DXY appears to be stronger than what I would have expected for the recent pullback in rates and the rally in equities. Still very much in trend
Country ETFS: China losing steam
Nothing much has happened since I last mentioned it here. Dropped a bit and so far fails to pick up while overall sentiment has improved
Risk factors:
- Housing, jobs and FOMC data coming this week
- Major geopolitical event like China invading Taiwan. We have seen plenty of provocation from the Chinese lately
Current positions
While I played with some speculative names in the SPAC space and retails favorite on long side last week, I have left only a wild fly in BBBY with 2/3 size. Thursday price action was enough for me to decide that I want almost all of my portfolio to be short right now
Exited TLRY given broad market levels. Long term view is in tact, but I do not want to be distracted with drawdowns as I expect the market to pullback and affect the position
Long QQQ put flys with x2 the normal size. This is my preferred index to play on the short side as I also have a bearish bias for bonds at these levels
Long AAPL puts as another proxy for a general pullback in risk assets. This play offered me the best risk-reward and therefore I took it
Potential Trades
- I like my book and believe a short QQQ trade here is definitely worth it
- There are a ton of sector ETFs and commodities at good technical levels that one could play either for a small pullback (mainly for the sector ETFs) or trend continuation (in GLD or HG_F)
- TSLA’s stock split is coming close on 25 Aug. Hoping for a move up to give me a better level to short it
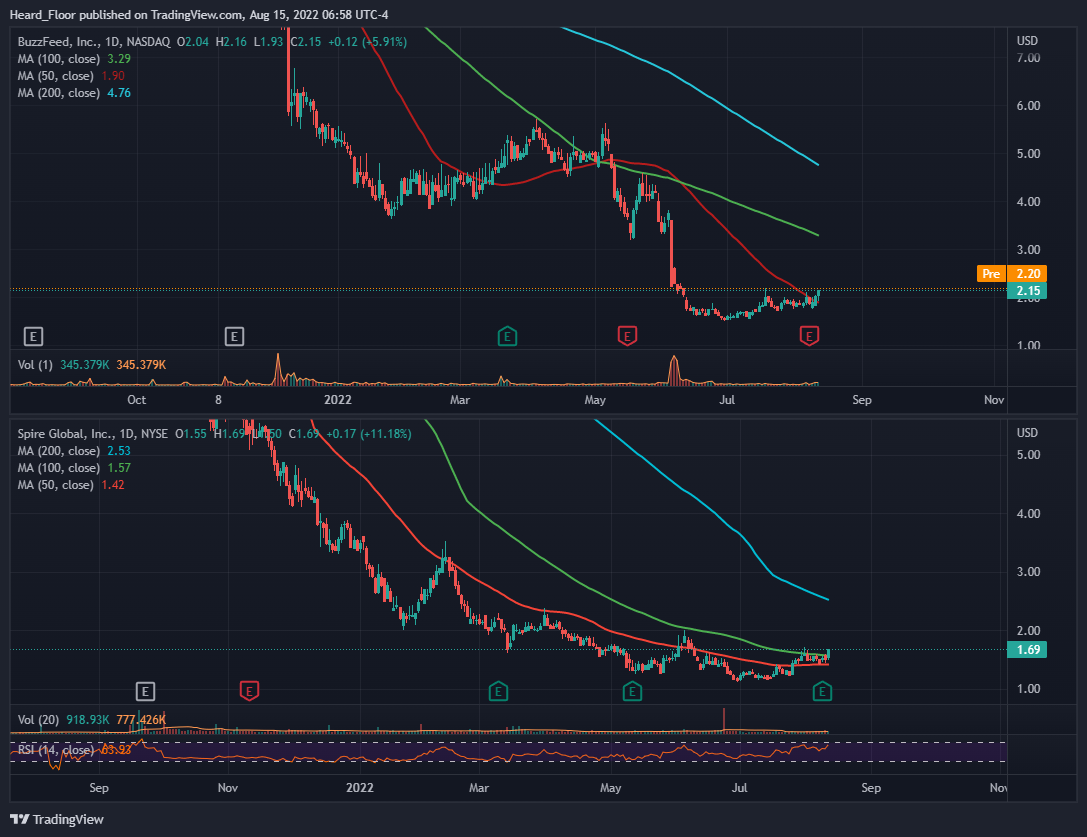
- For those willing to get long, there is positive price action in beaten down SPACs. Downside here should be limited and long bases are formed. Will get long again once/if the broader market retraces to a good level. Some tickers that I picked up and then exited are SPIR, BZFD, etc. Those still look very good on charts
Conclusion
I am short the market and believe the market is due for a pullback. Getting long here the broad market in the short run is a call for markets to take your money. While it might not happen, you are certainly putting yourself against the odds. Plenty of sector ETFs and commodities are at key technical levels and allow one to properly structure a trade with a favorable risk-to-reward. While this is not a call for retesting the lows or anything similarly bearish, I do think that things have gotten too far a bit too fast and substantial bidding at this levels would be low. Important economic data and OPEX week are ahead and some volatility may arise. On top of my swings, I plan to be active with intraday SPX put spreads and ratio spreads to size up the short position, when/if price action confirms.
This is OFM Capital’s own research, published for information only. It is not investment advice or an offer of any kind. We may hold positions in the securities mentioned.