
Will credit traders get Christmas presents this year?
First published in Heard on the Trading Floor
Written in December 2022. Prices, yields and positions have changed since.
The Santa rally had been widely spoken about on Twitter in the past weeks. Many swear by it. I am personally a big fan of this period but not in the traditional sense. Let me explain:
We are entering the final two weeks of the year. Seasonally speaking they are favorable for a number of asset classes. In the past I used to trade seasonality patterns by taking the long side only, trusting that there is some magical force that pushes my selected assets to the upside. Turns out, things don’t really work out that way in trading. I began seeing the little nuances. There is the seasonal tendency for multiple stocks and credit instruments to go up in that period but on a relative basis they perform significantly better compared to their benchmark ETFs. If you pair trade a product with their benchmark ETF , you will end up achieving significantly better risk adjusted returns and you position yourself to profit even if the equity or bond markets decide to sell off during that period.
You can clearly see this tendency by looking at the high yield and investment grade credit spreads. They all seem to tighten in the final 2 weeks of December. At least as measured by HYGH and LQDH.
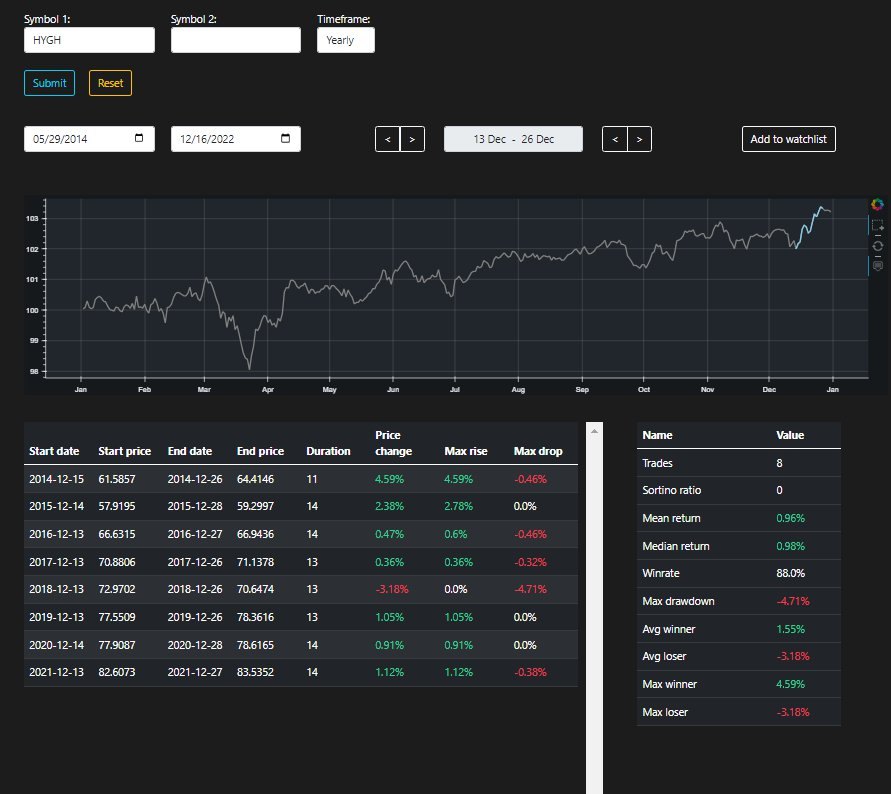
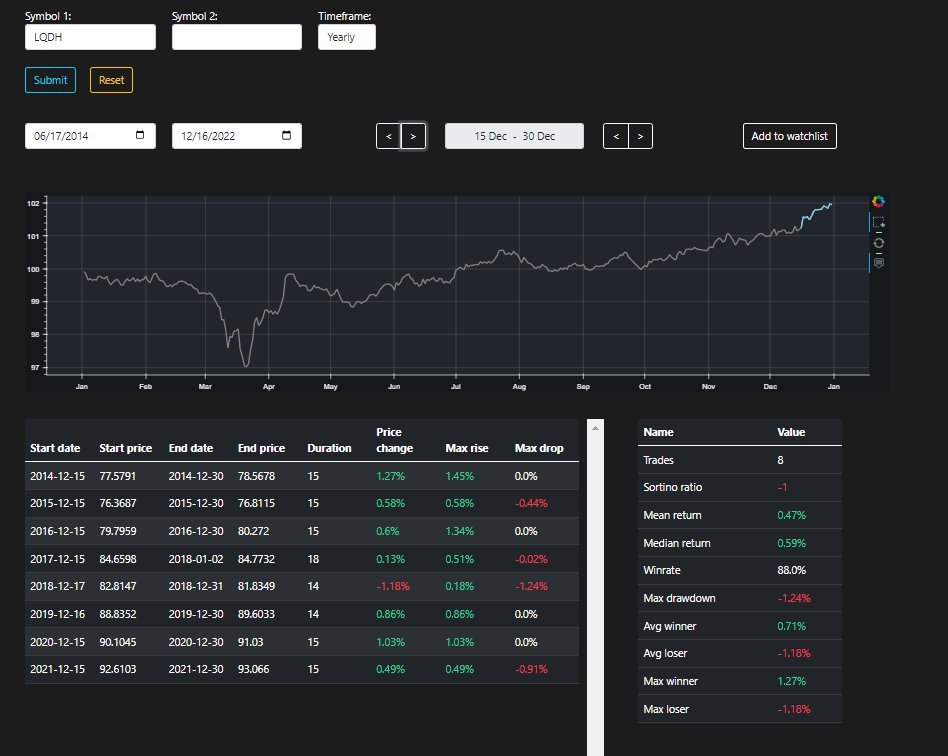
WHAT ARE THE CHARTS TELLING US:
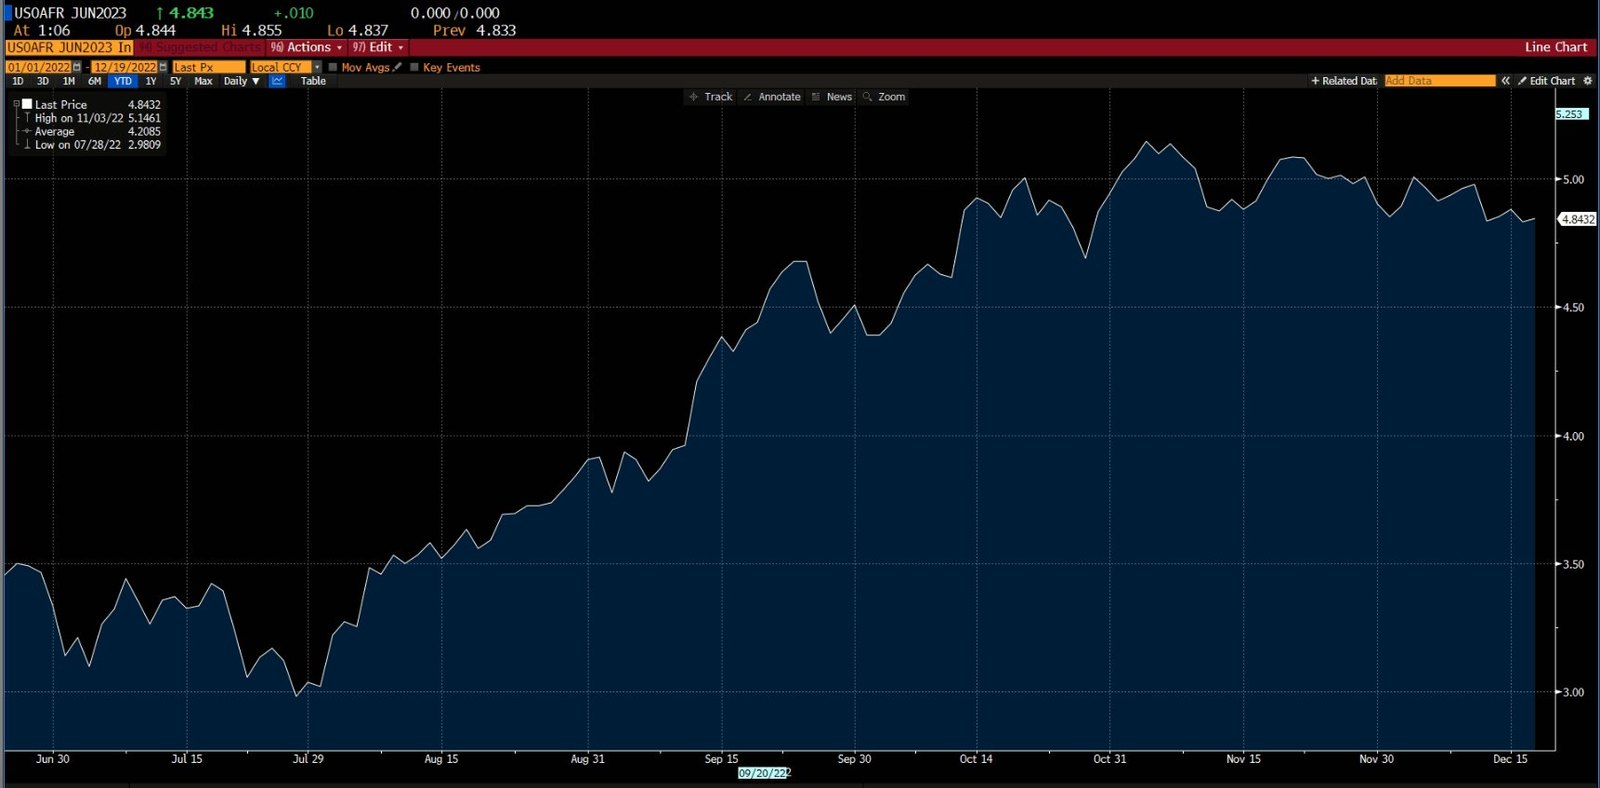
FED FUND FUTURES. After last week’s CPI report the market brought down the terminal rate by 25bps to 4.8%ish from 5.1% in the beginning of November. To me this is not yet a meaningful evidence of pivoting. I read these moves as slightly lowering the levels at which the FED will ‘pause’. Pausing is still in the cards and this is what we will see in 2023, unless the economy deteriorates very rapidly.
The Jun’22 highs in yields served as support as expected. There was a quick trade for the adventurous traders. I personally messed it up and shorted ZB_F futures a little too late which led to bad entry prices and not so good risk to reward. I am still of the opinion we hold the support line until year-end. The level in question will be key in 2023. It would mean that breaking it to the downside is effectively the market trading a recession. There will be no doubt about it.
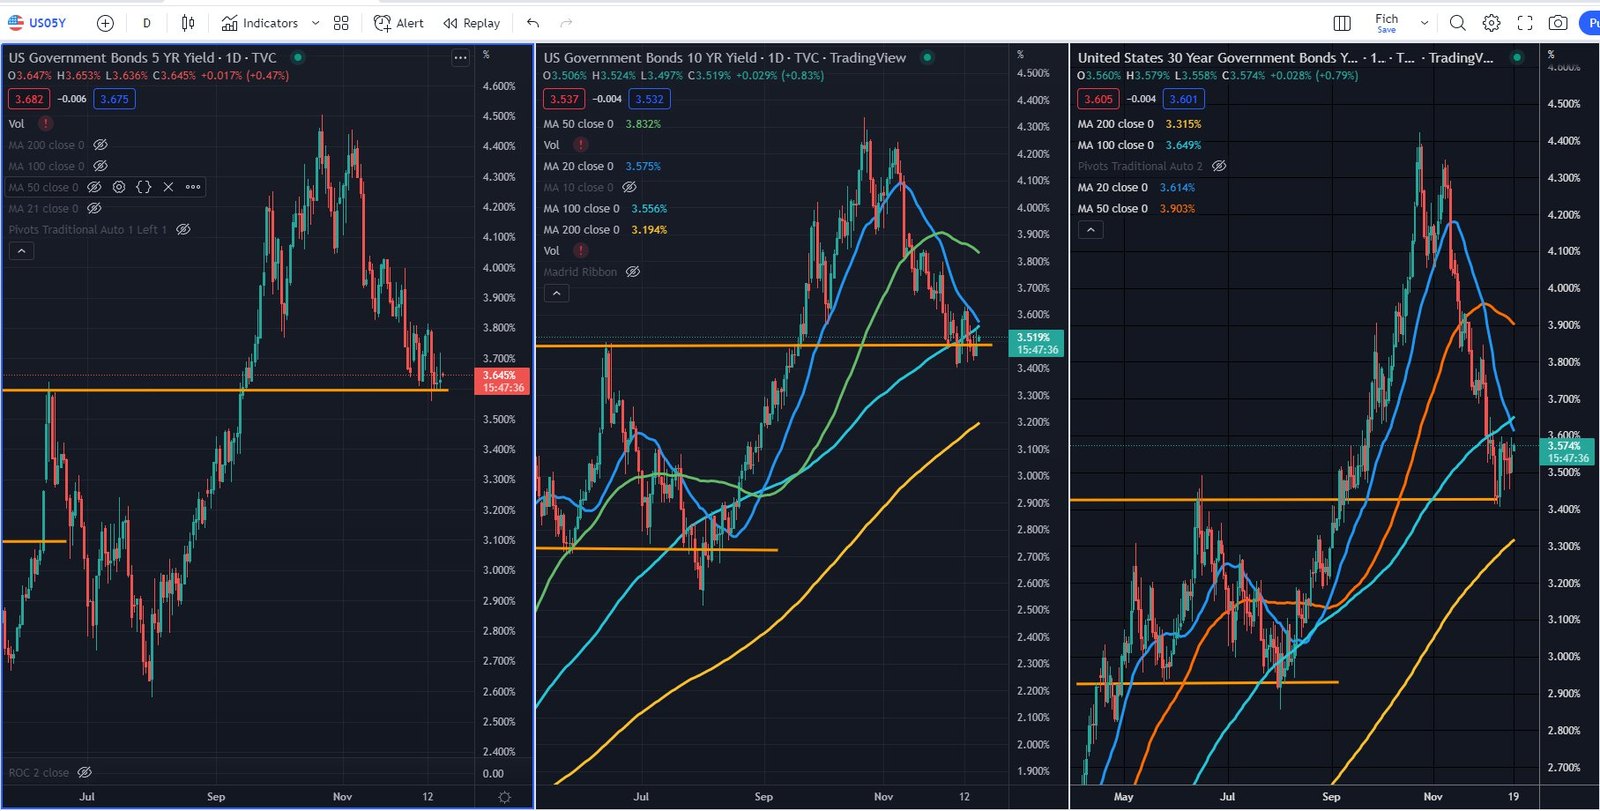
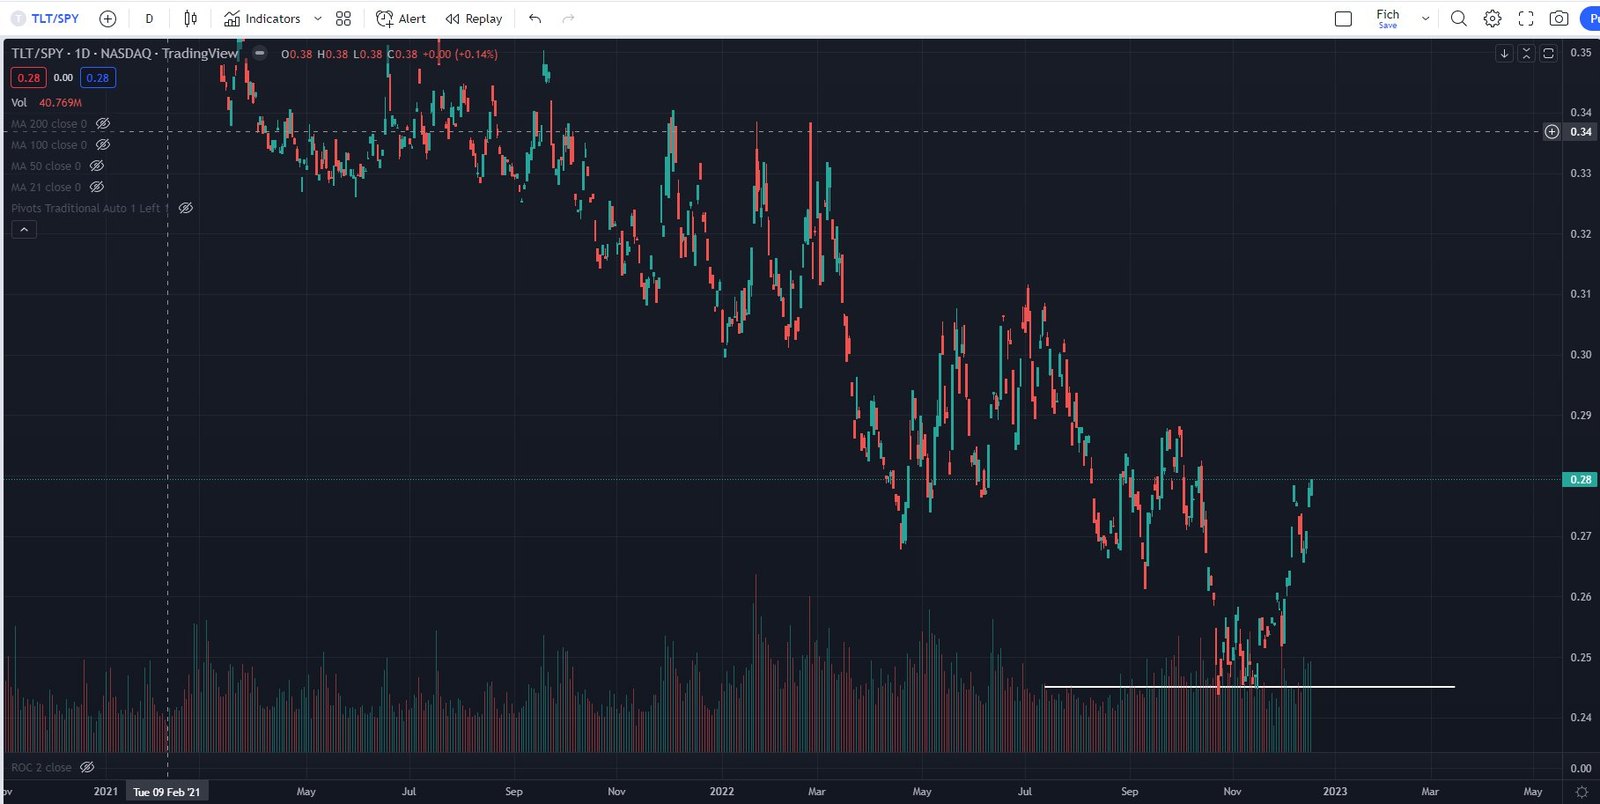
I’ve been pondering on a potential recession lately. The long-end (ZB_F and UB_F) had been showing relative strength lately and I wondered why that might be the case. As time goes by the thoughts of witty market participants positioning themselves for a recession narrative began making the most sense. If we plot the TLT vs SPY , this is getting very clear and loud.
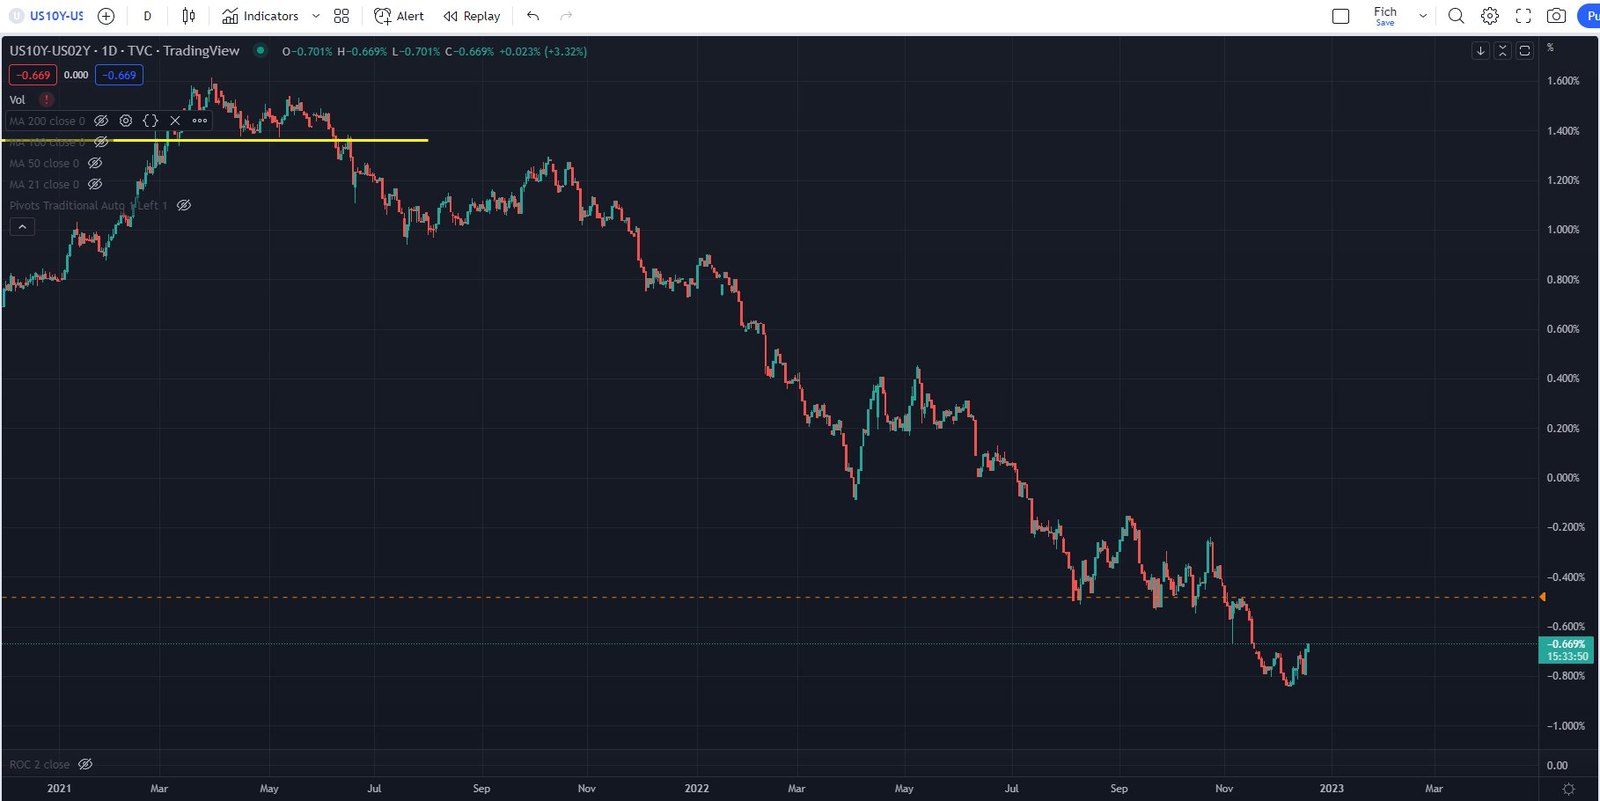
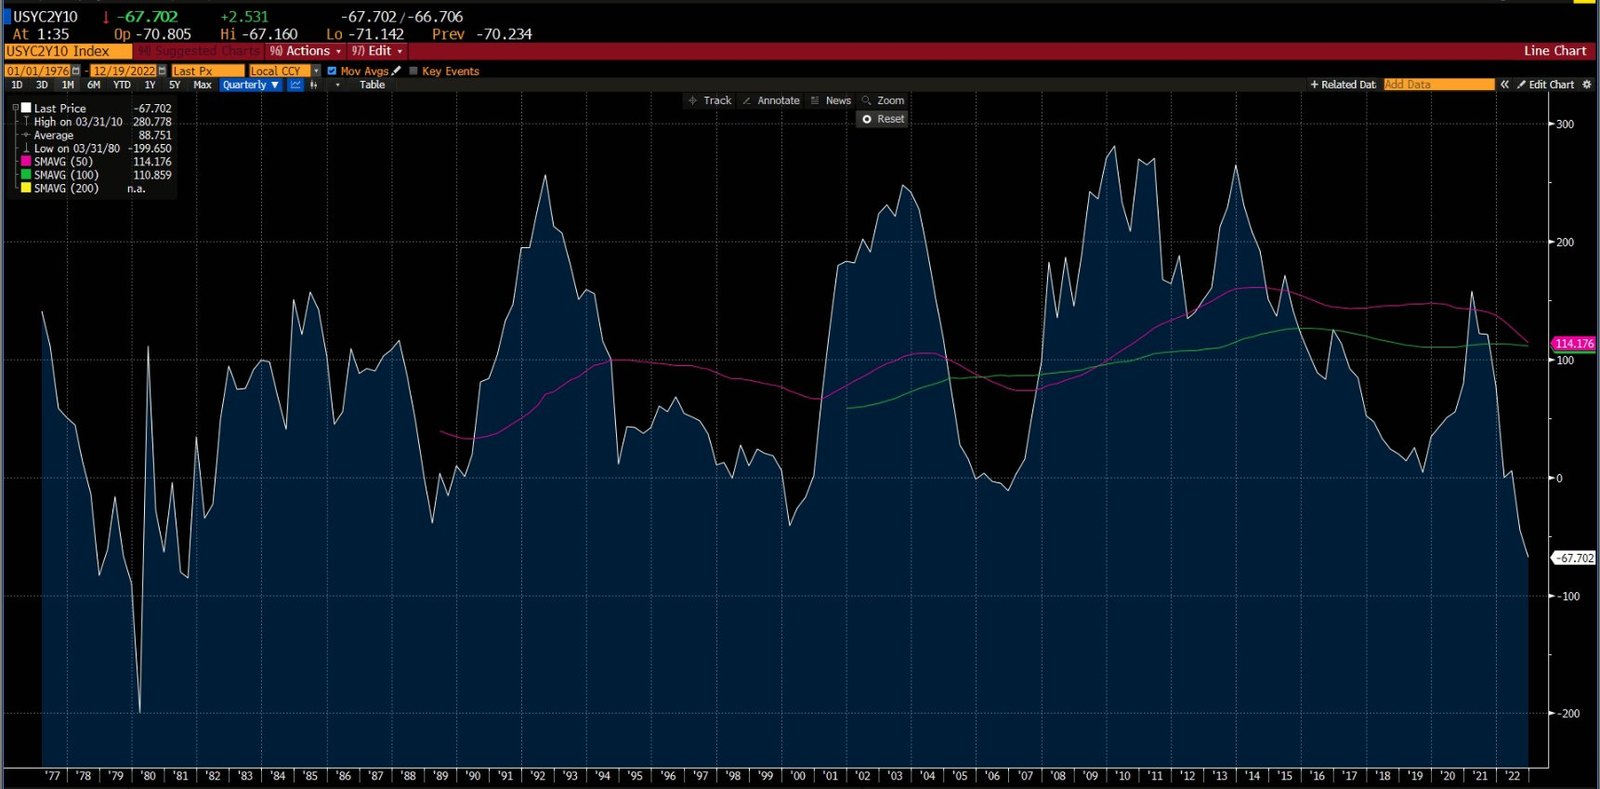
We may have witnessed the biggest inversion in the 2s10s in our trading careers 2020s. I believe the lowest point was -0.84%. This was the lowest point since the 1980s Volcker hiking period.
CURRENT POSITIONS:
We have 2 new positions as of last week.
A steepener trade in the 2s10s
An outright short in ZB_F ( $TLT)
Still holding long G-Spread trades in REPHUN 34s and ROMANI 31s. This one is taking significantly longer than expected but thanks to Mrs. Lagarde we saw the spreads moving in our direction. Not liking paying the borrow for a prolonged time even though it is relatively cheap.
4. Long GP 7.25% 28s at 110.08 (US373298BP28) vs IBIGG3 at $127.25 (LQD) futures.
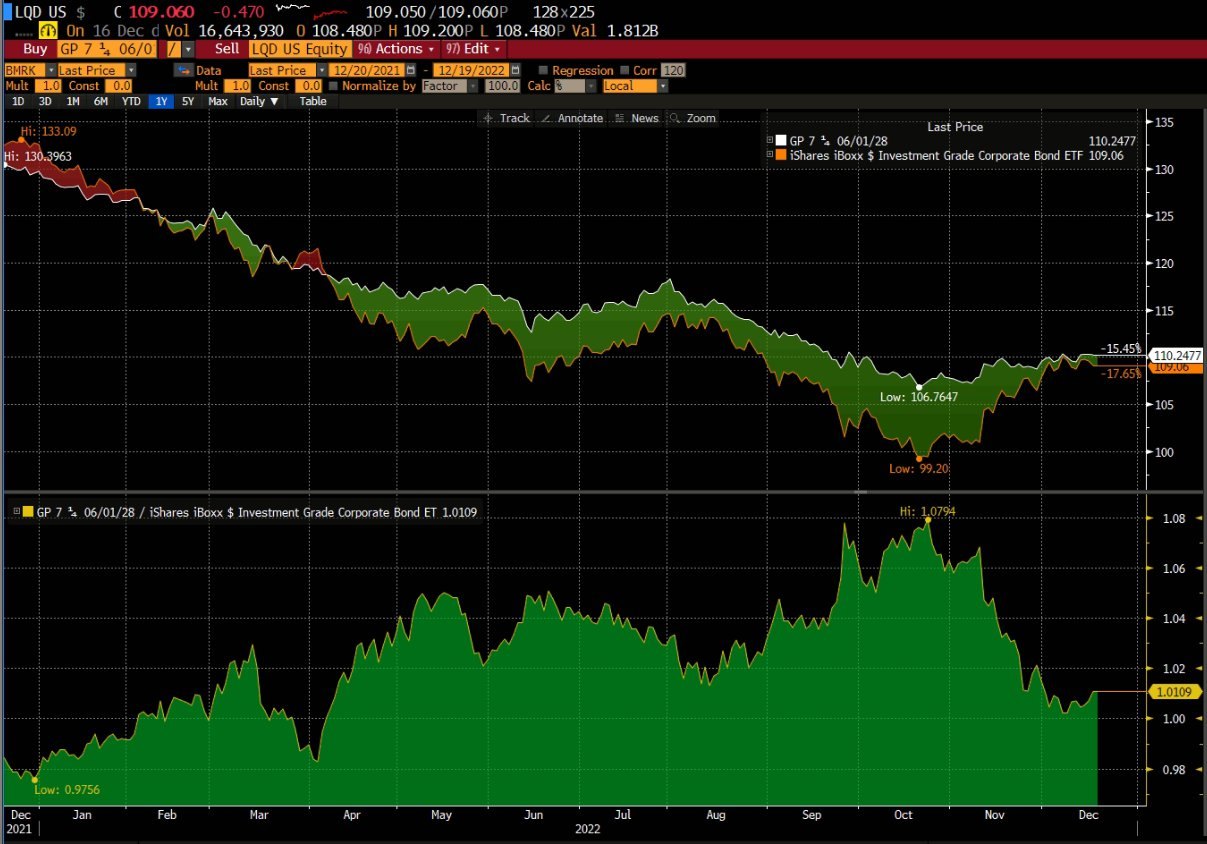
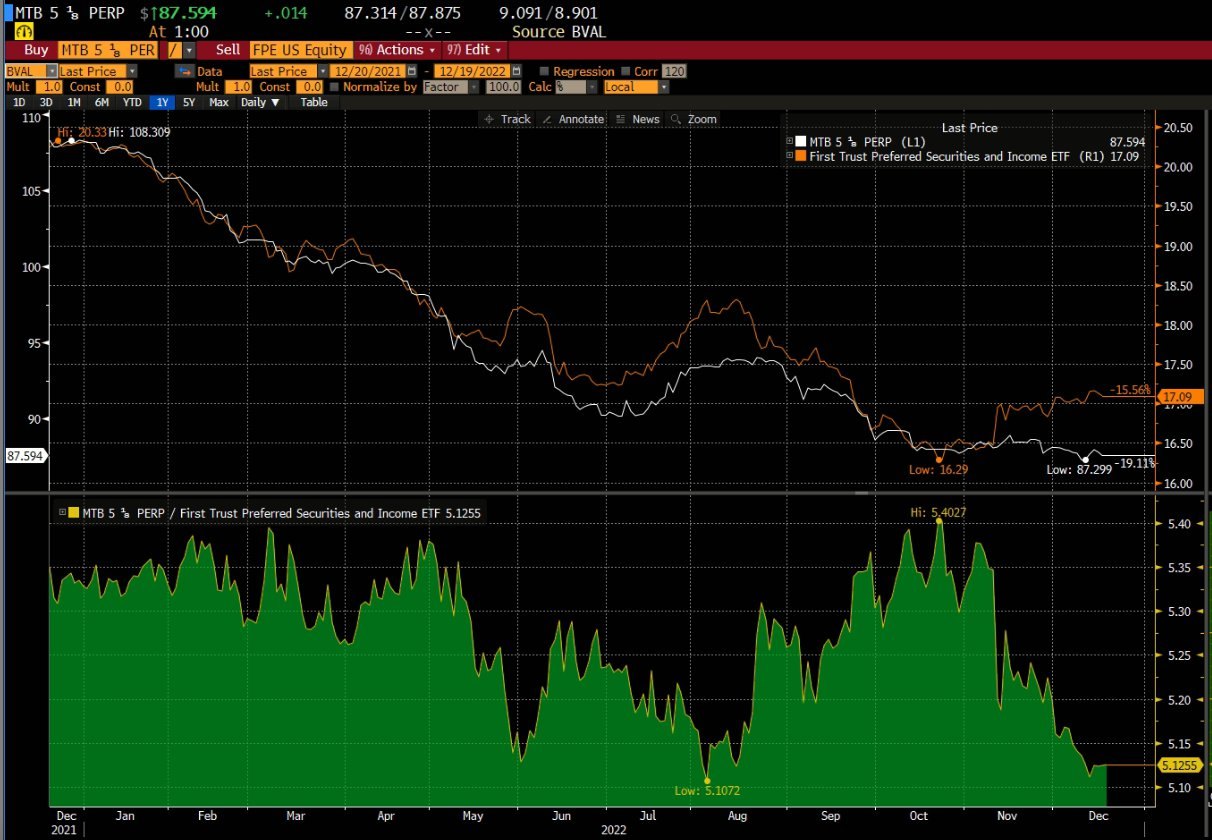
5. Bought MTB 5.125% perp vs FPE. A pure pair trade play with the intention of taking advantage of the seasonal tendency of less liquid credit instruments to outperform. Chart wise it is at the best spot to be initiated and the risk to reward is phenomenal.
POTENTIAL TRADES
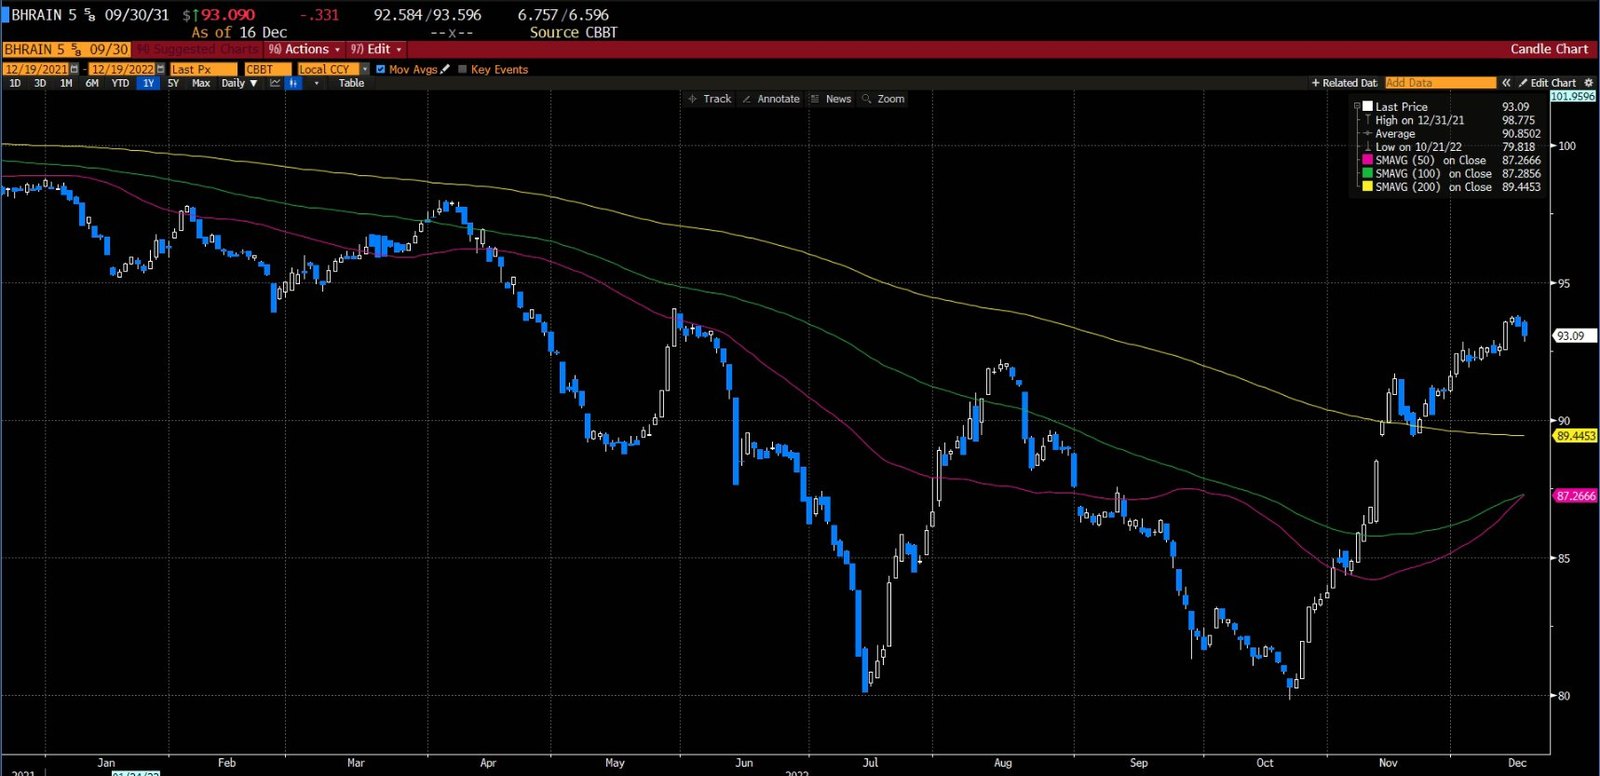
I am building a list of all the potential shorts that I want in the final 2 days prior to New Years Eve. I hope they will get more extended. This will present us with significantly better risk to reward.
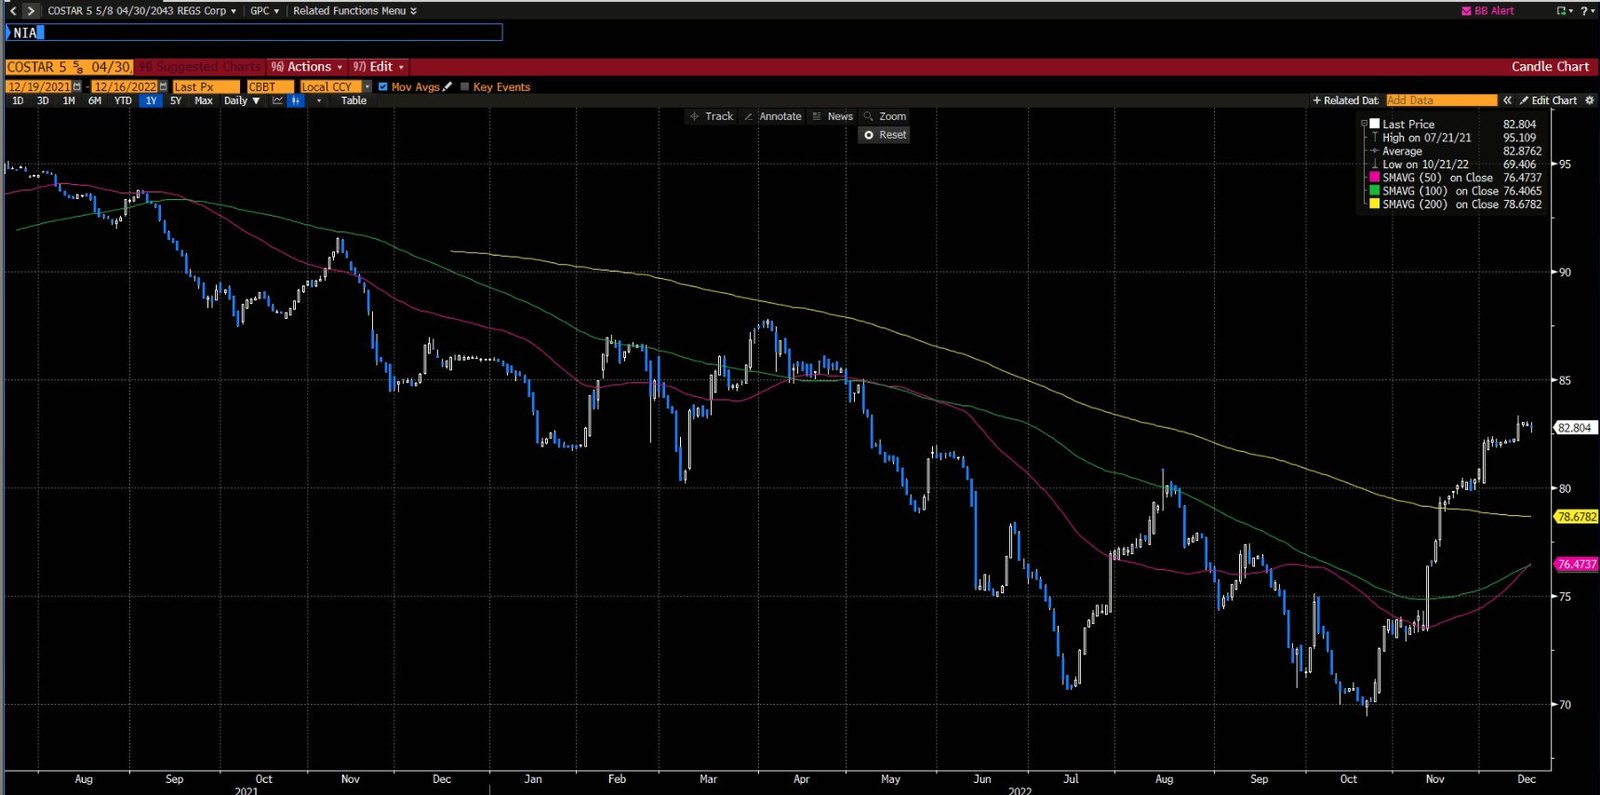
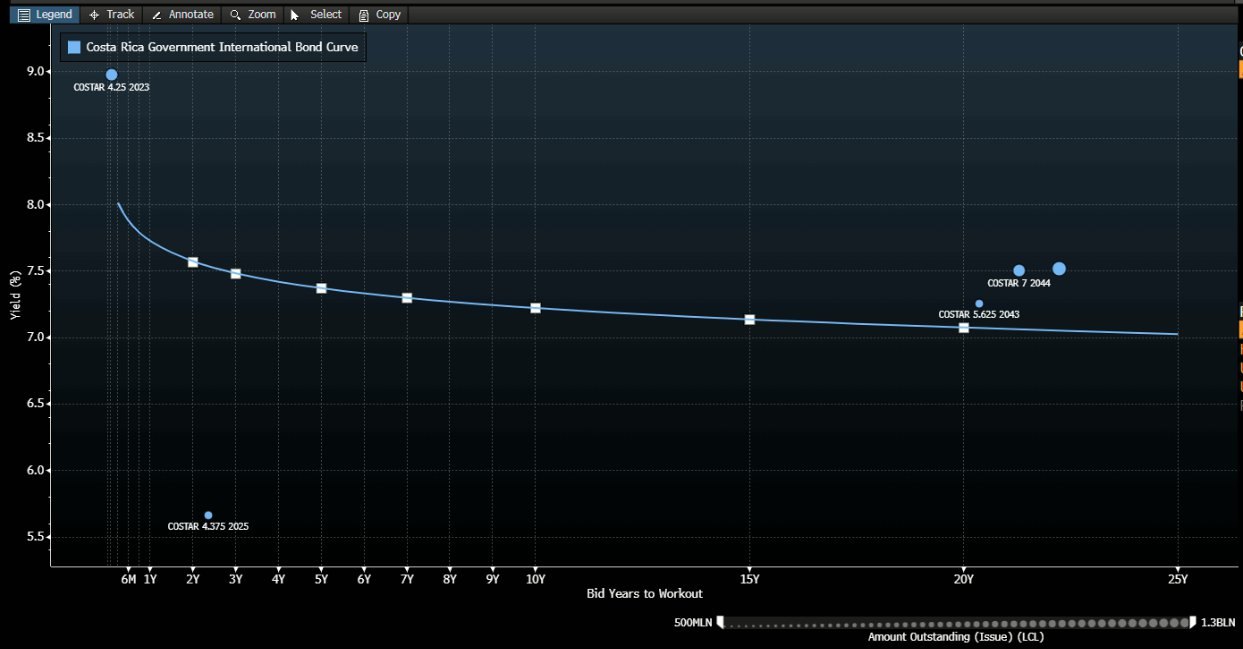
COSTAR 2043s
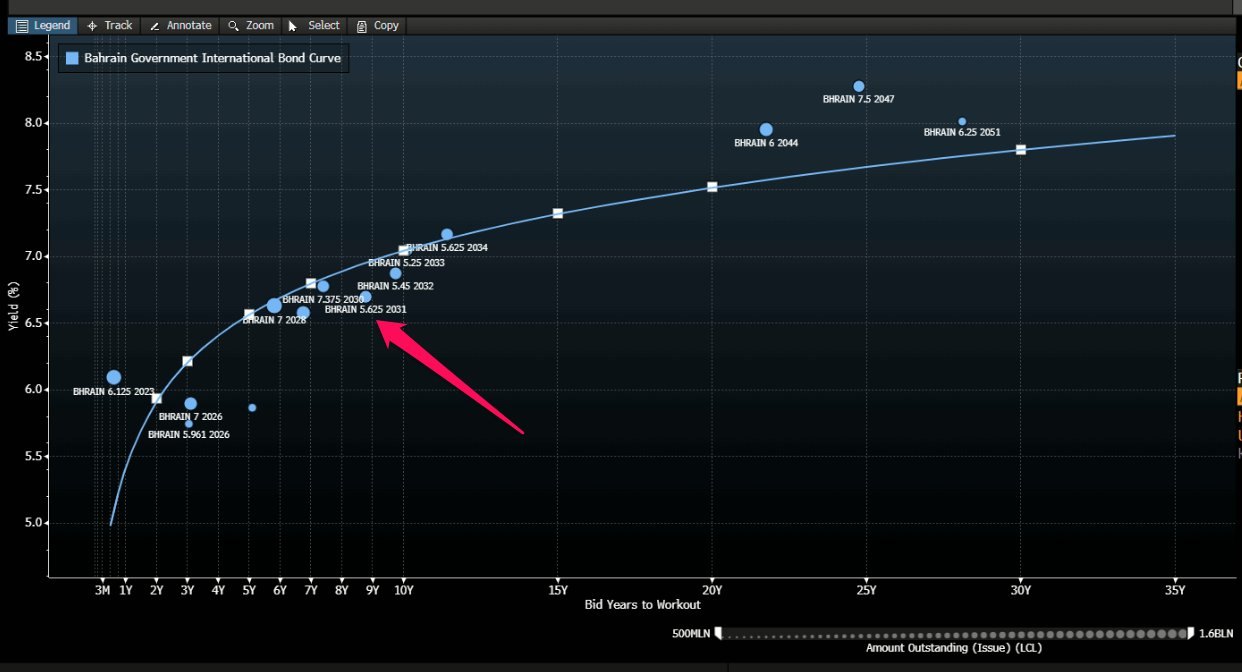
2. BAHRAIN 31s
CONCLUSION:
My view for the next two weeks is to play seasonal credit patterns hedged with their benchmark ETFs. I will start buying them at the end of this week as I noticed the final week is the best time to take advantage of these seasonal patterns. Just before we get to celebrate New Years eve I will begin shorting the above mentioned EM bonds (I hope there will be liquidity) and whatever else I find overvalued as I believe we will see credit spread expansion in the start of 2023.
This is OFM Capital’s own research, published for information only. It is not investment advice or an offer of any kind. We may hold positions in the securities mentioned.