
We got the rally, now what?
First published in Heard on the Trading Floor
Written in November 2022. Prices, yields and positions have changed since.
We have had a week worthy enough for the history books. I am not sure if the shorts were squeezed or value chasers were buying like mad immediately after the release of CPI. Rarely do we get 5% days in SPX without a meaningful pullback.
With everything said and done we need to see what the charts are telling us. It is one thing to ponder about the next direction of the market based on gut and feelings, quite another to include facts in your decision.
WHAT ARE THE CHARTS TELLING US:
1. Fed Funds Futures not changed significantly. We witnessed only 15bps drop in expected terminal rate in Jun’23, from 5.08% to 4.93%. This translates to potentially 1 hike less than what was previously priced in. To me, nothing meaningfully had changed and the market is still pricing 5% terminal in the spring of ‘23.
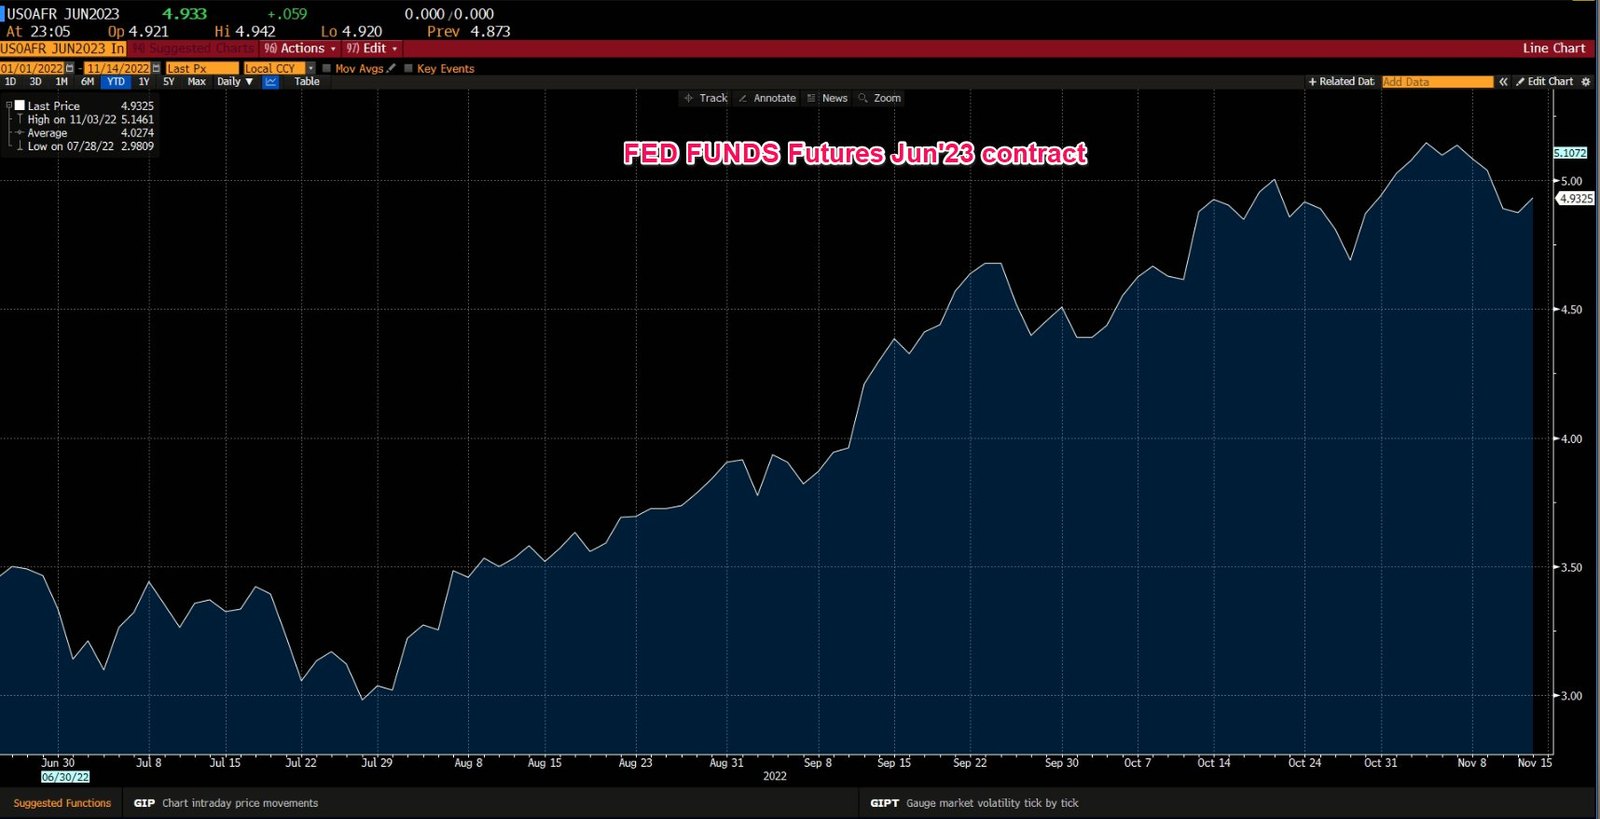
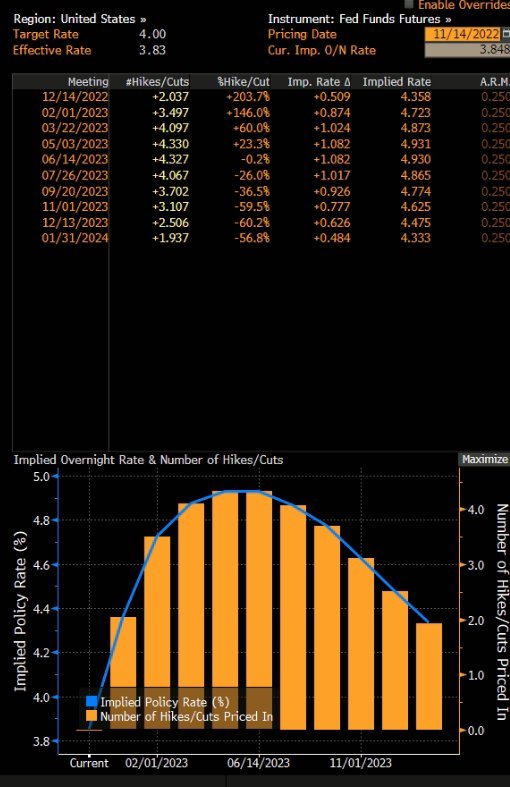
Although this is a credit review, I have strong feelings about the valuation of SPX at current levels with expected rates at 5%ish. Equities do seem significantly overvalued currently. For comparison, in August, when the market squeezed to the 4300 level, the Fed Funds Futures were pricing a terminal rate of 3.75% . I don’t claim to be a specialist in equity valuations but do realize how important a factor the Fed Funds Rates are. If the market tries to squeeze to the 200D SMA, I think it is worth building a 6-9 month put position in SPX. An additional argument is the potential for a recession as evidenced by a slowing CPI. If recession slows down more meaningfully in the coming months, the market GURUs will start fearing recession which would change the current narrative from bonds up/ (down) > equities up (down), to equities down > bonds up due to the expectations of recession and subsequent rate cuts.
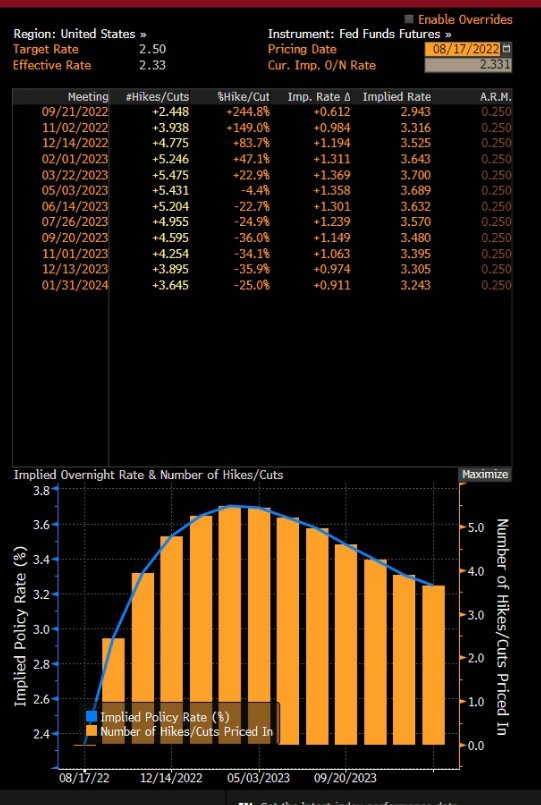
5Y , 10Y and 30Y yields need some time to digest the large weekly moves. Nothing goes up or down in a straight line. We had 40bps drop in rates across the curve in the span of 2-3 business days. However I think the G-spreads will keep narrowing as we will very likely see window dressing in the cash bond world into year-end. Plenty of credit funds are underwater, they must do their best to soften the blow.
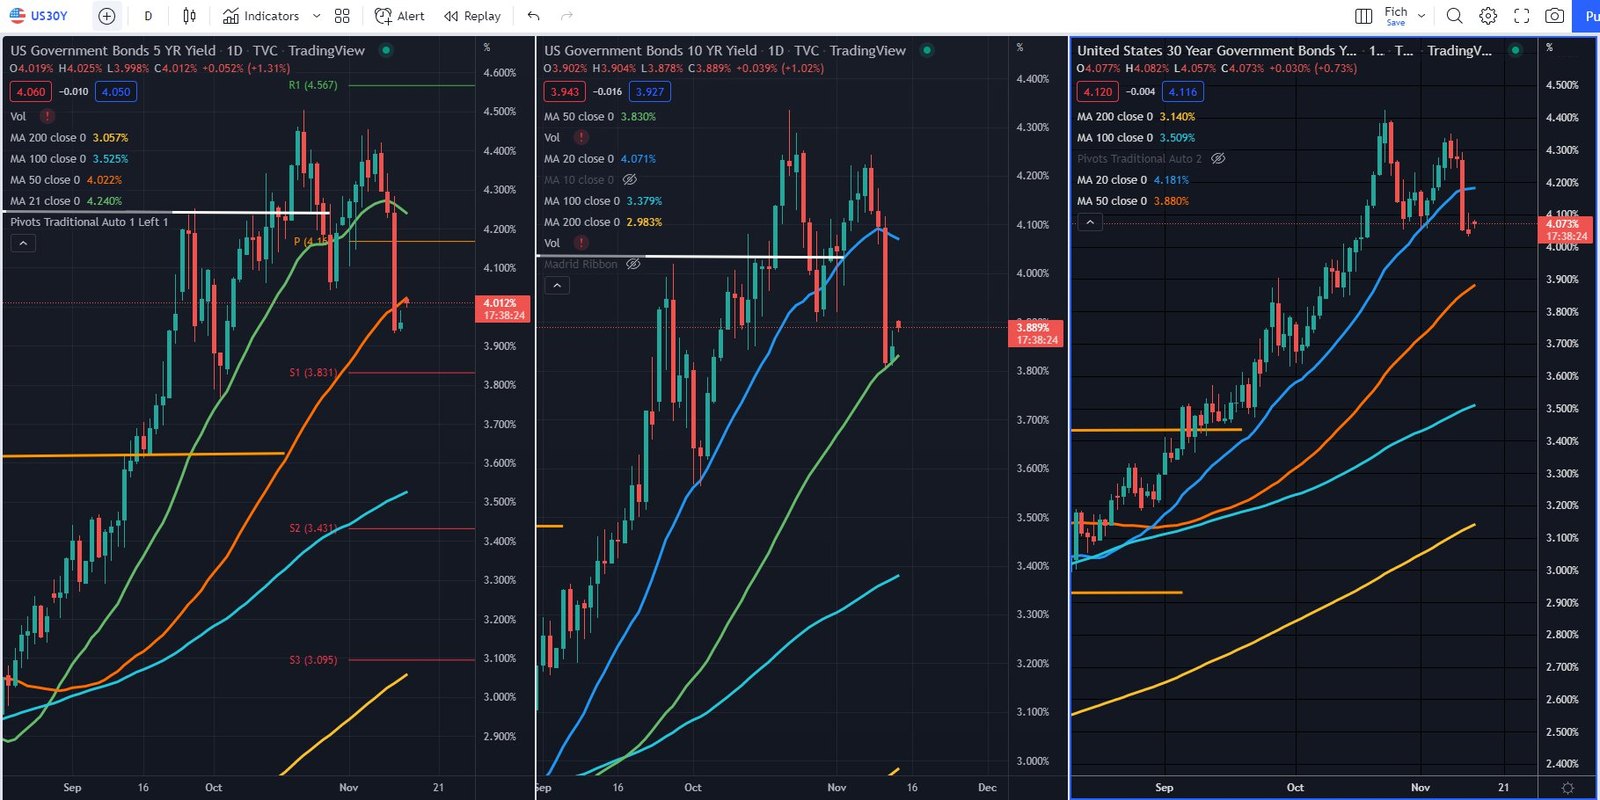
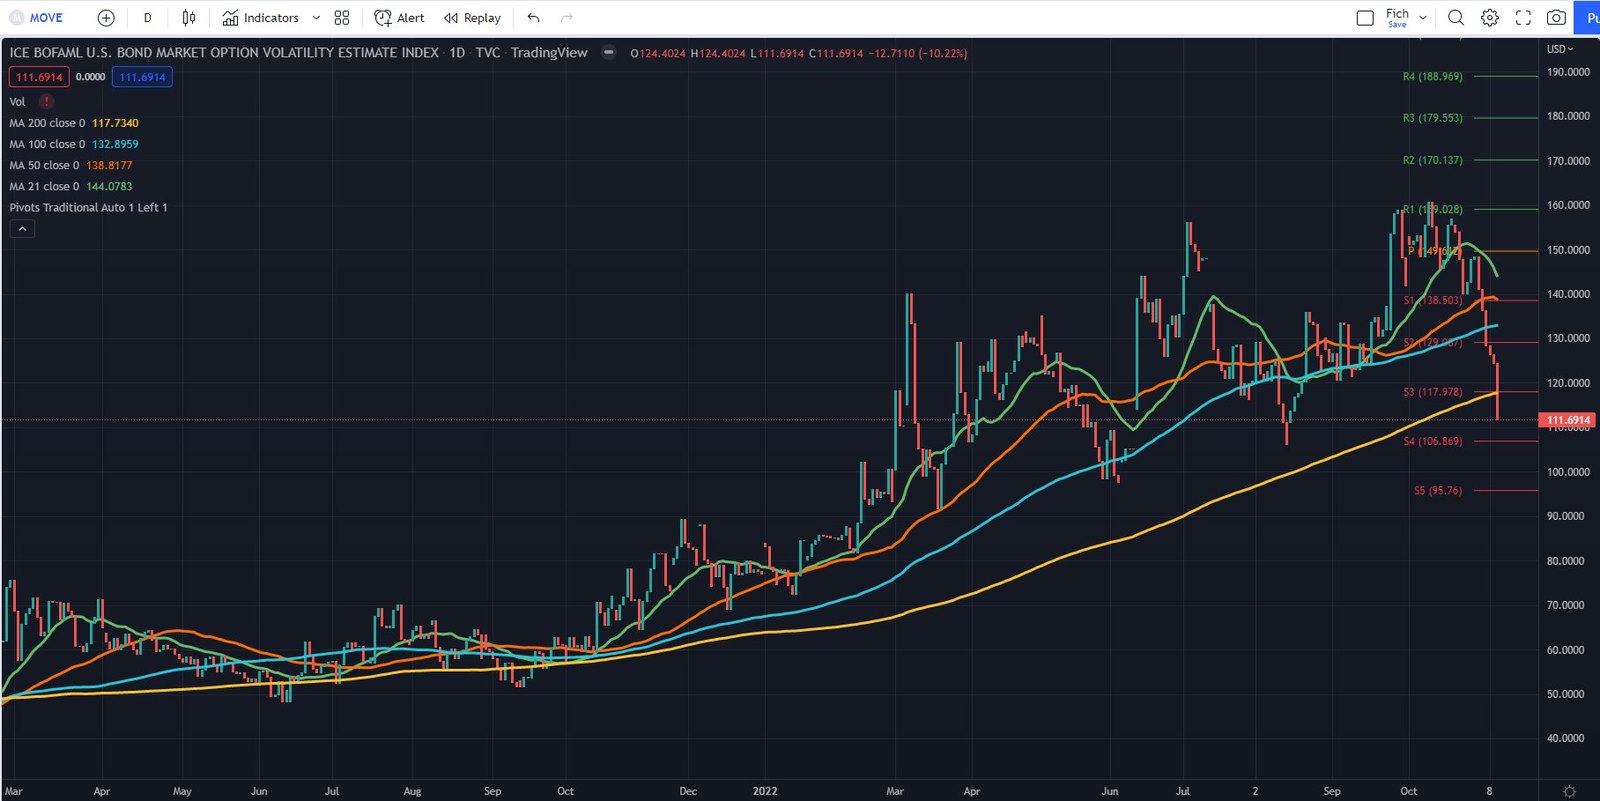
3. MOVE index very close to the Aug’22 lows (pre-Jackson Hole)
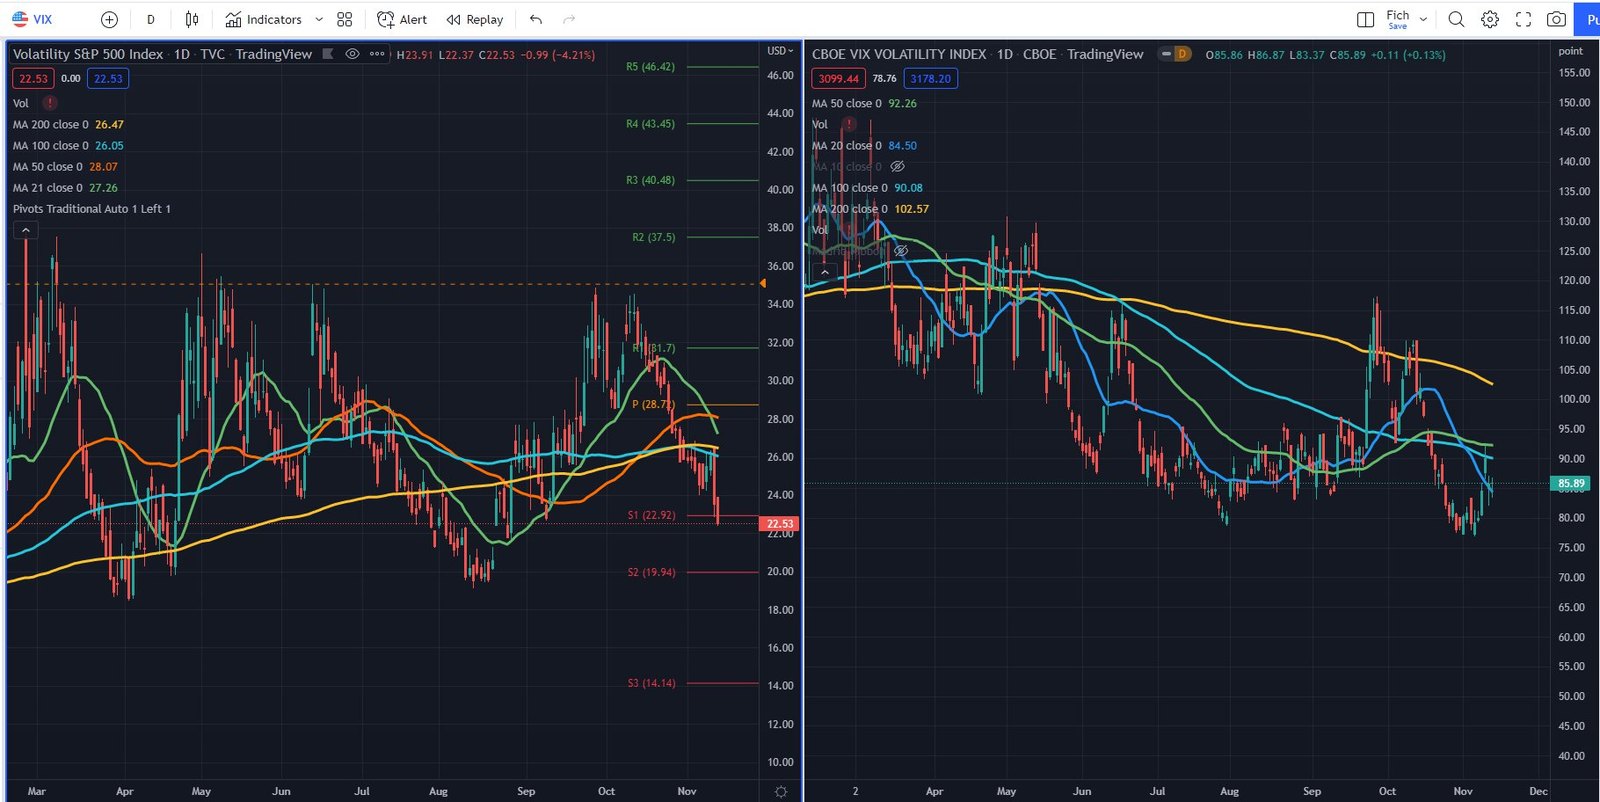
4. VIX and VVIX are still at the lows or very close to the lows. This means there is no fear in the market which would be supportive of declining CDS prices, translating into more primary market action in the coming weeks, if we stay at the current levels.
5. iTraxx Crossover very close to the Aug’23 lows level of 450ish while CDX High Yield still has room to go as it is far 50bps away from the lows, while XO is 30bps away. This means the EUR denominated bonds will be able to issue at tighter NIP (new issue premium) compared to USD denominated bonds.
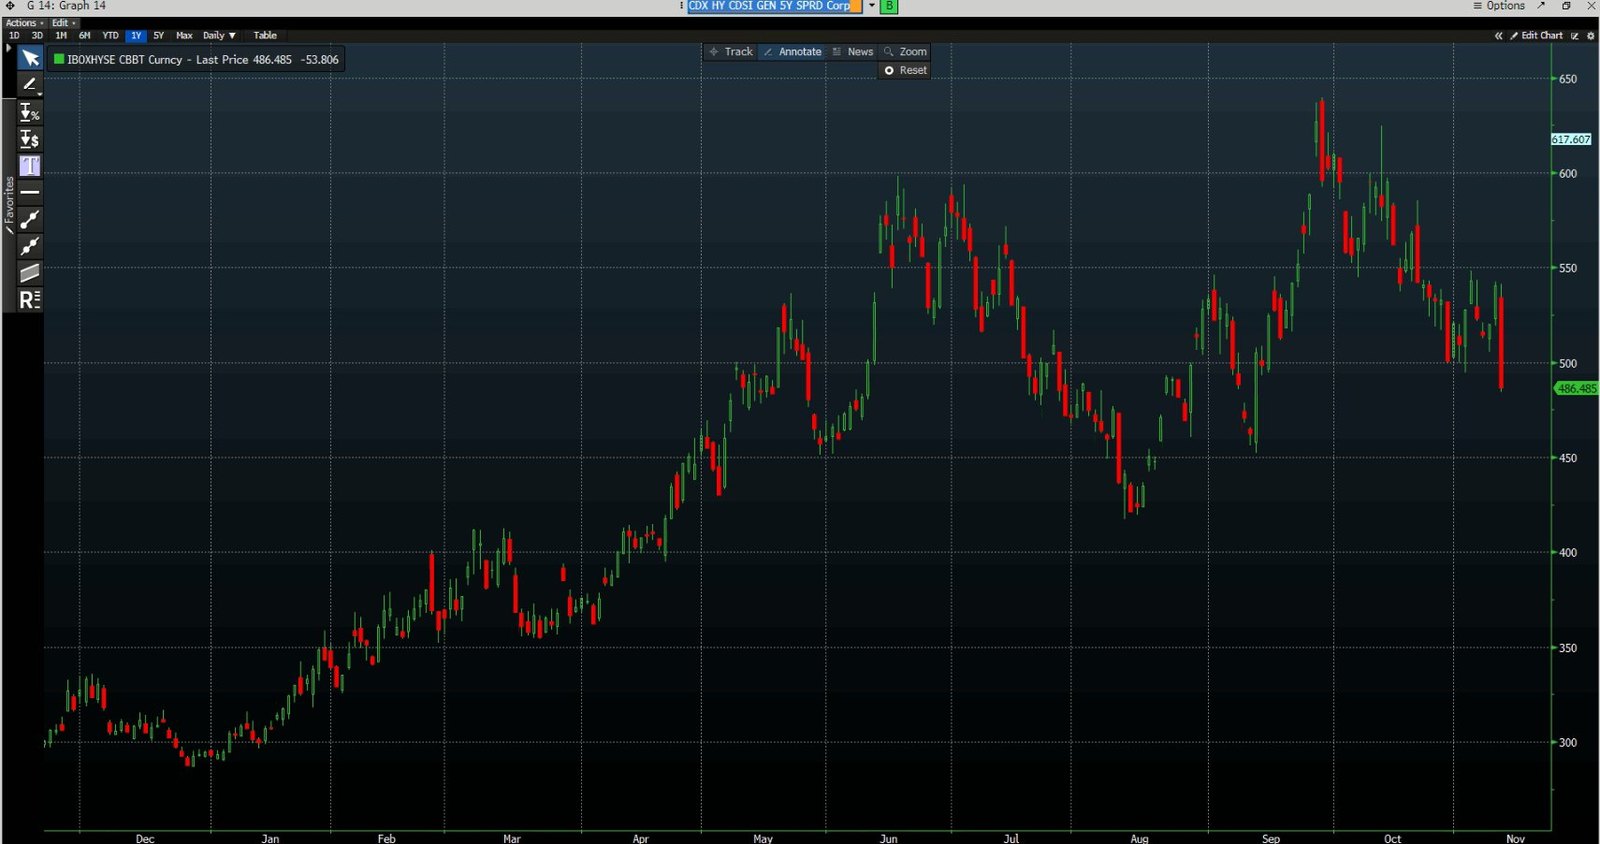
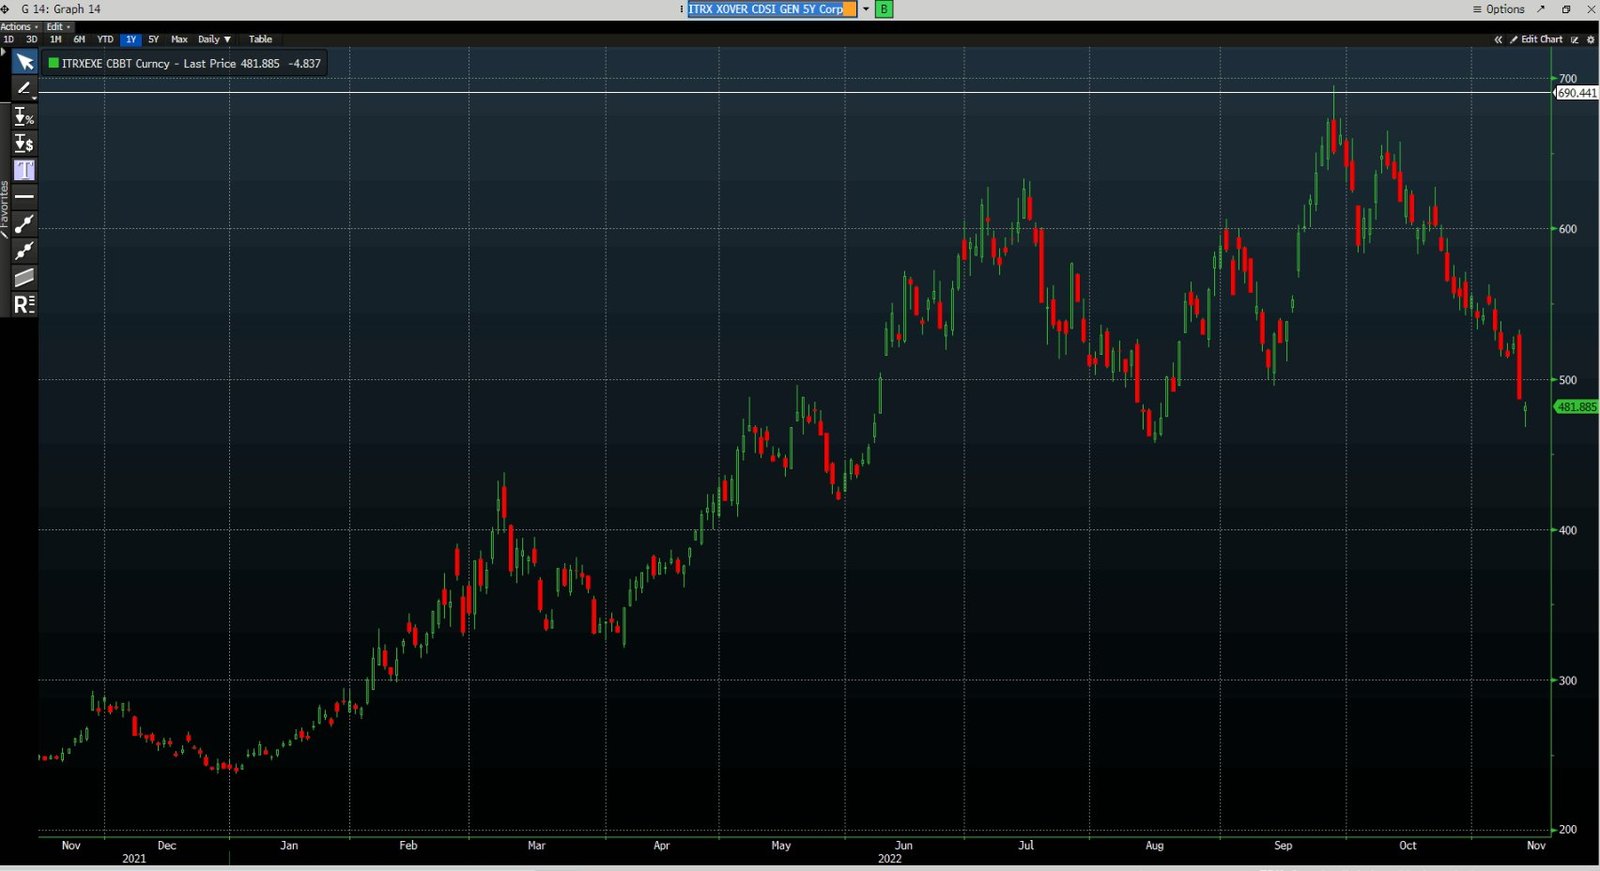
As of right now, I think it is increasingly likely we either consolidate at current levels or do a minor move to the downside in bonds (upside in CDS indices) . It takes time to digest such large moves and digestion happens in two ways: Consolidation or minor move to the opposite direction.
CURRENT TRADES:
We are still holders of the same assets but added 2 more Yankee bank AT1s:
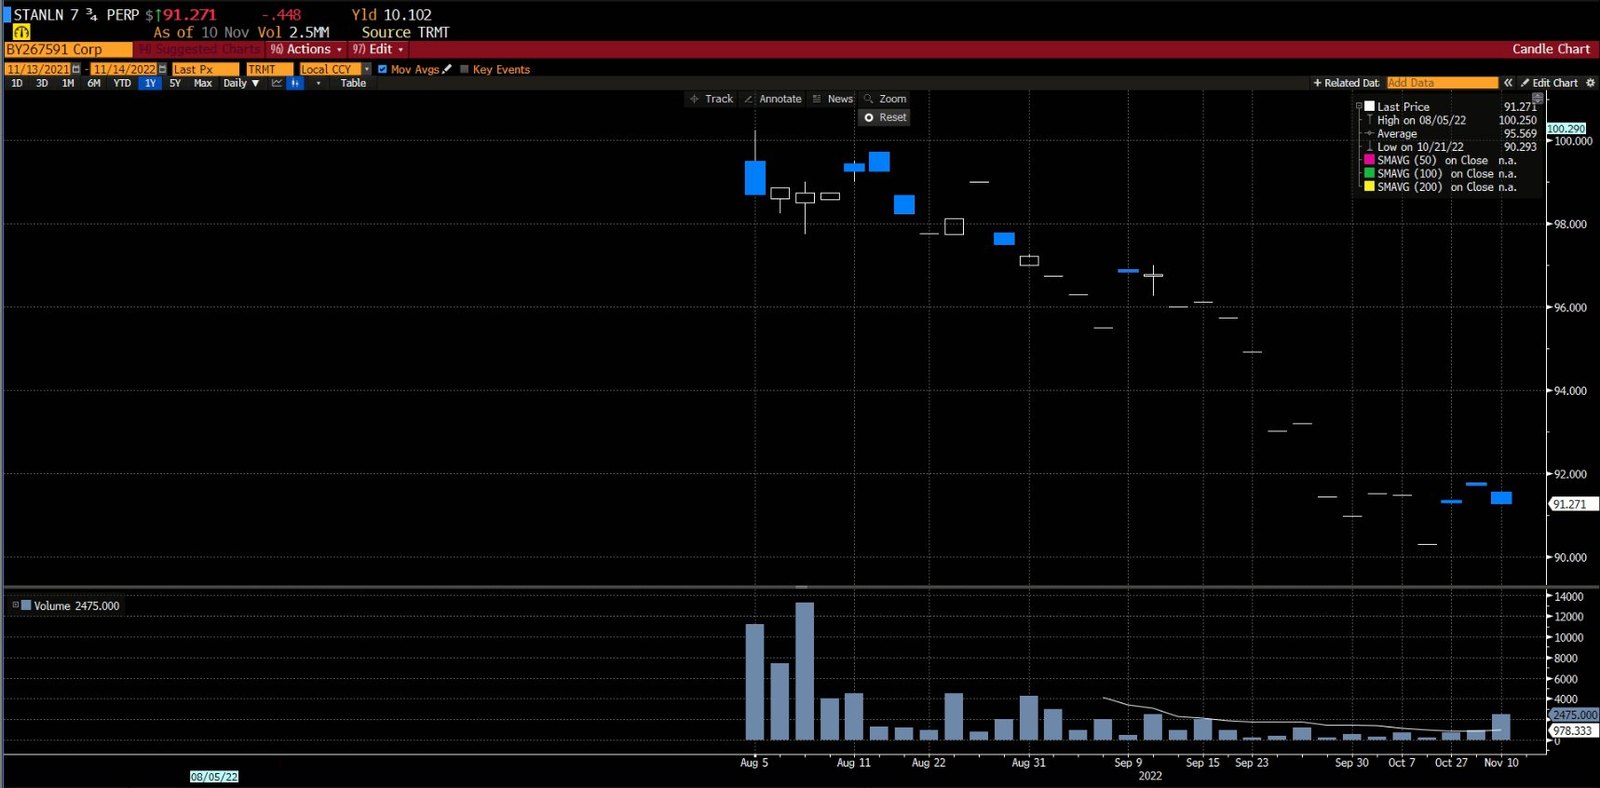
STANLN 7.75% at 91.50
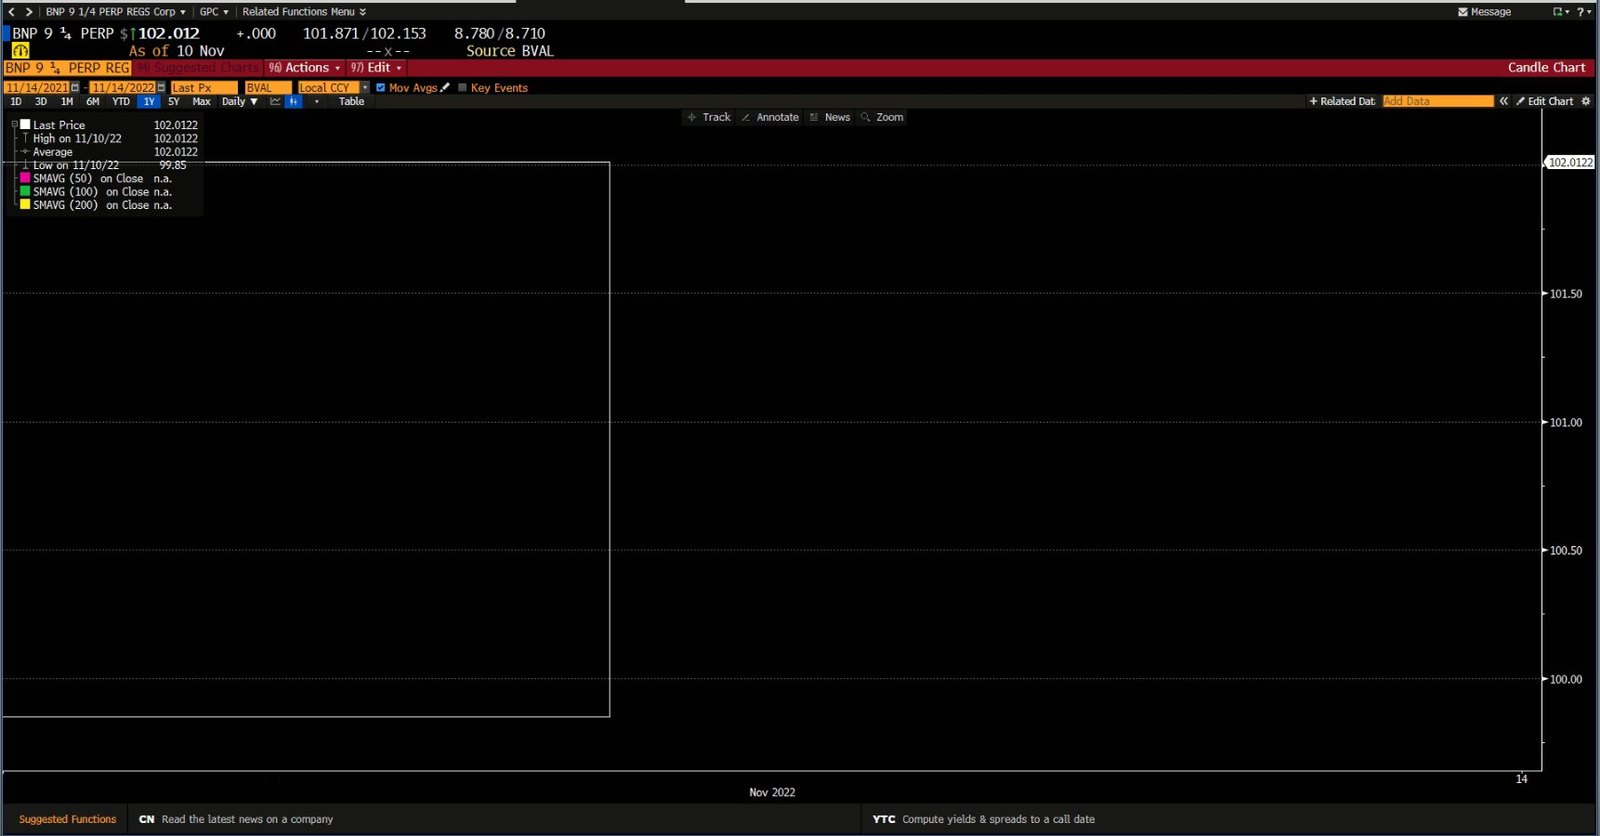
New BNP 9.25% at par. (primary)
Rest of portfolio is up significantly last week.
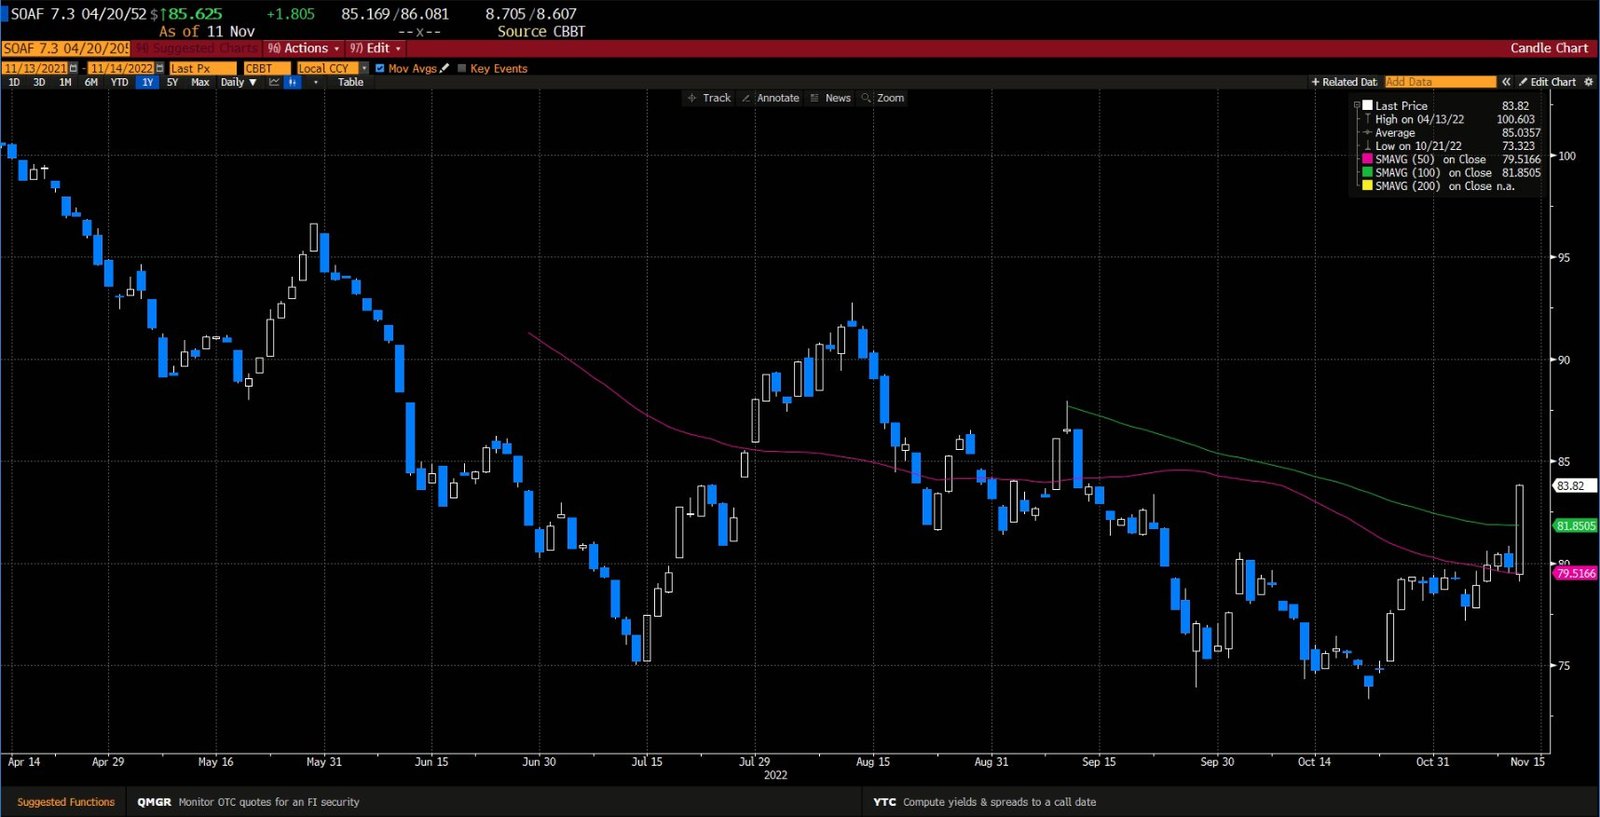
SOAF 7.3% 52s - As of this morning (11.14.22) we exited this position at 85.45.
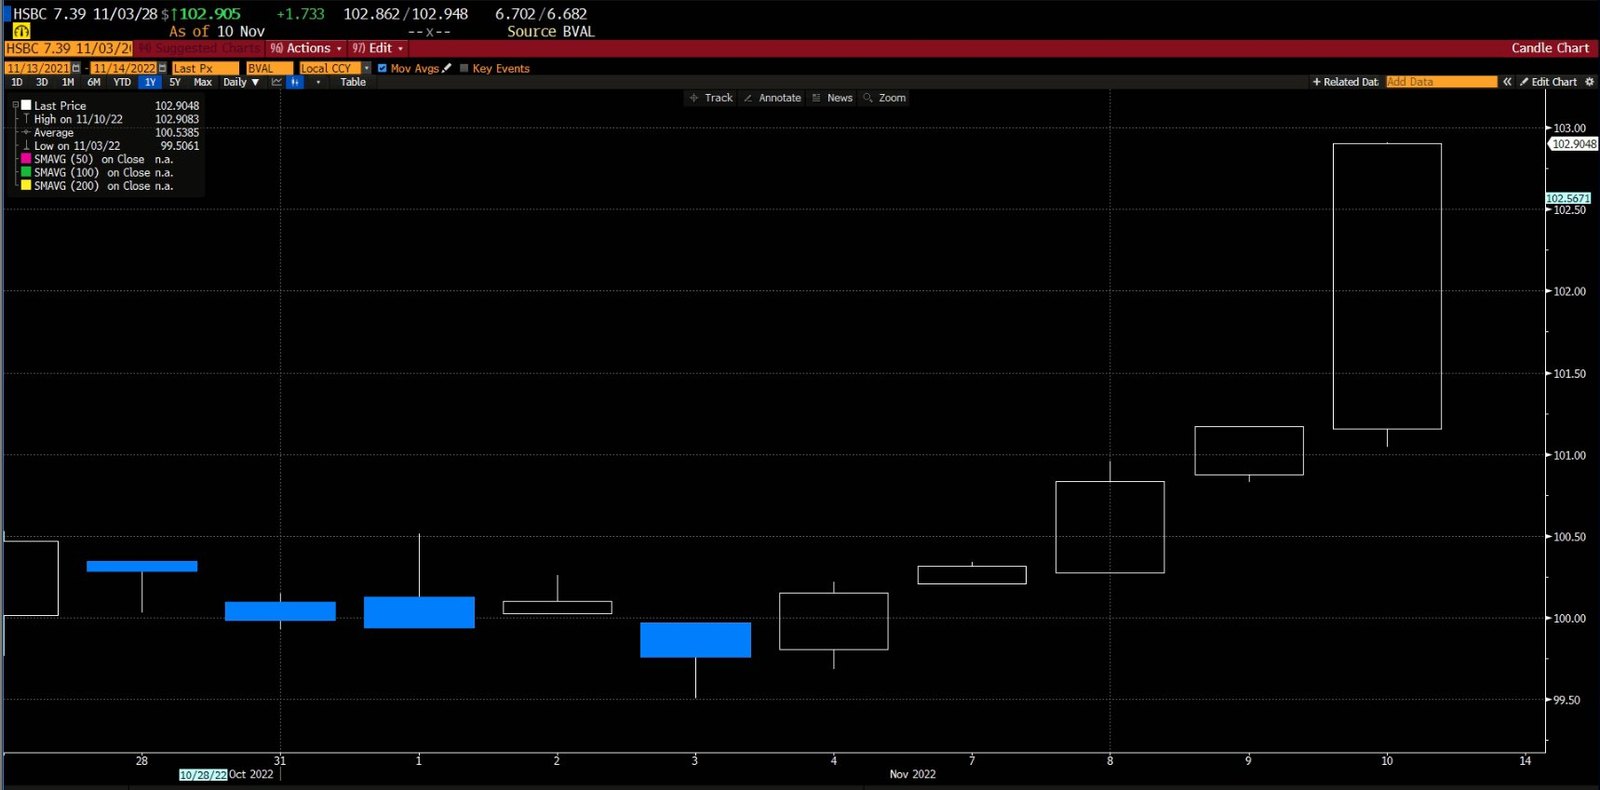
HSBC 7.39% 28s
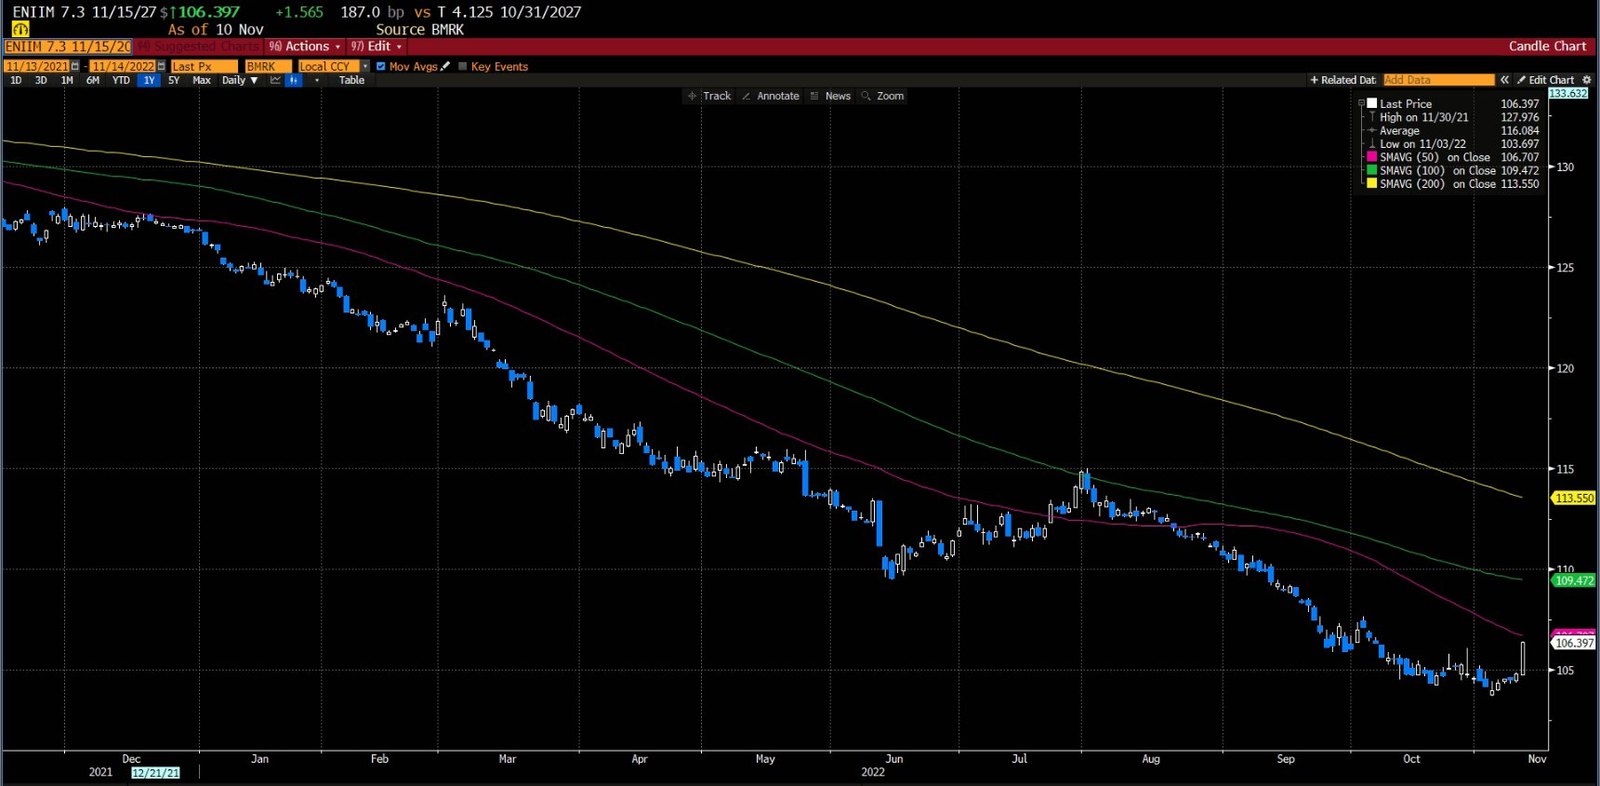
ENIIM 7.3% 27s
POTENTIAL TRADES:
As of the writing of this issue I am on the lookout for picking up USD AT1s and Perpetuals. They are slow to react and may present decent risk to reward potential at current levels. At the same time, I will look to exit SOAF 52s this weeks should I get a price of 85 or above.
POTENTIAL RISKS:
PPI on Tuesday
Retail Sales on Wednesday
Philly FED manufacturing
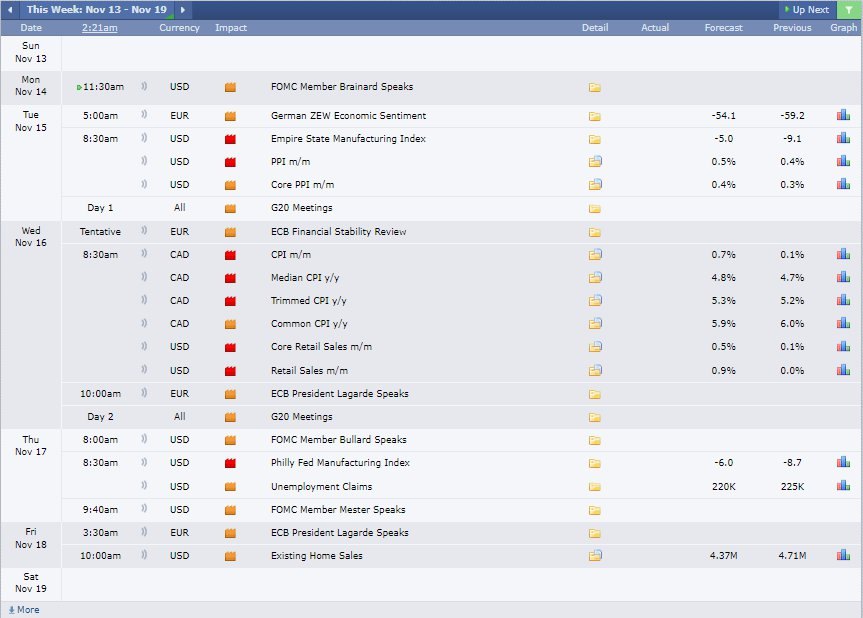
I don’t think they are as big market movers as CPI or unemployment numbers but may fuel the rally if they come in lower than expected. If stronger than expected we will see profit taking in cash bonds and equities.
CONCLUSION:
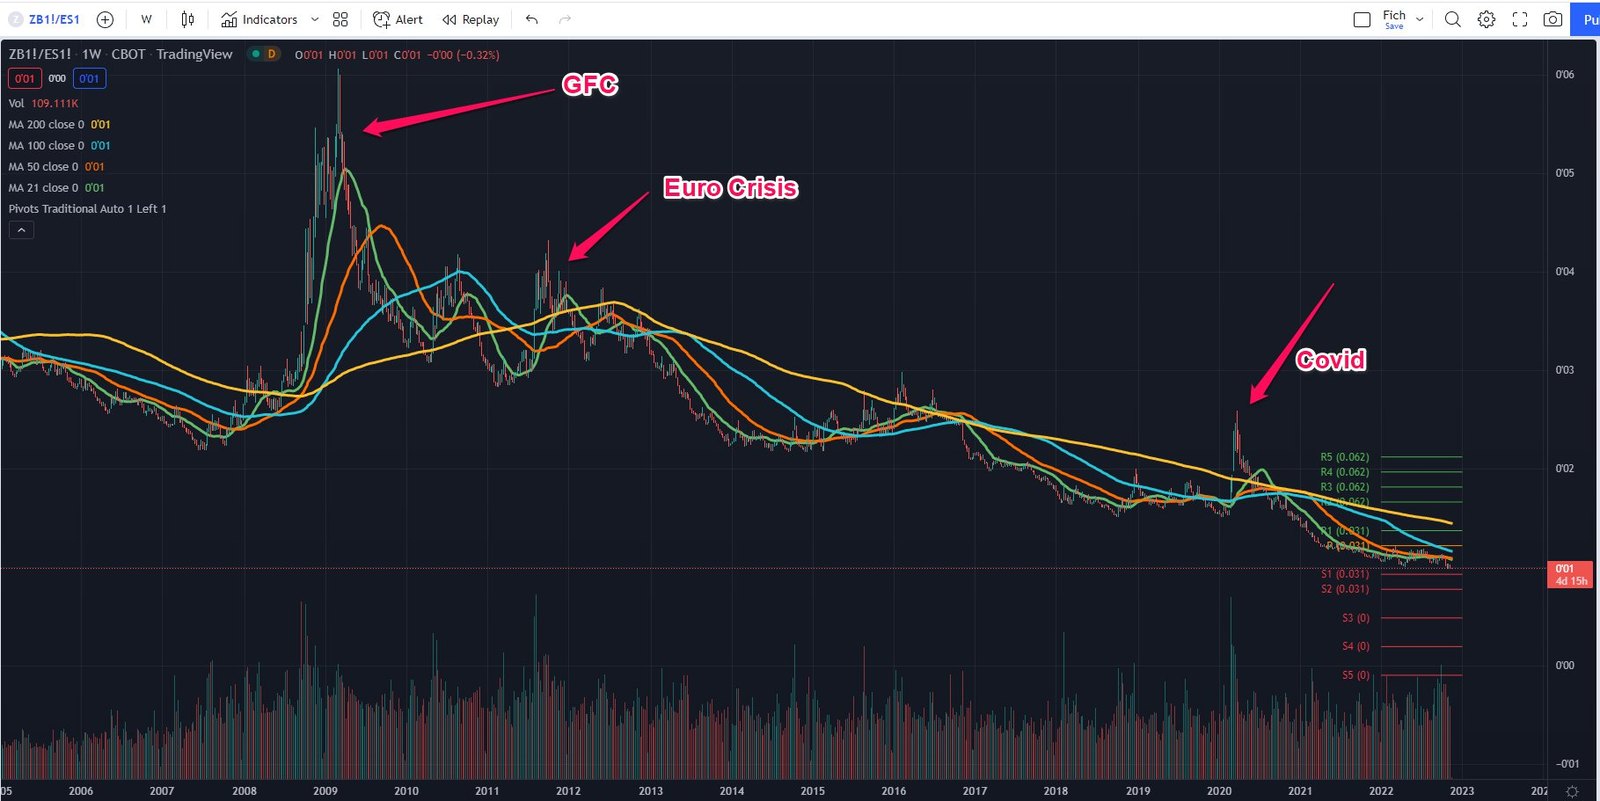
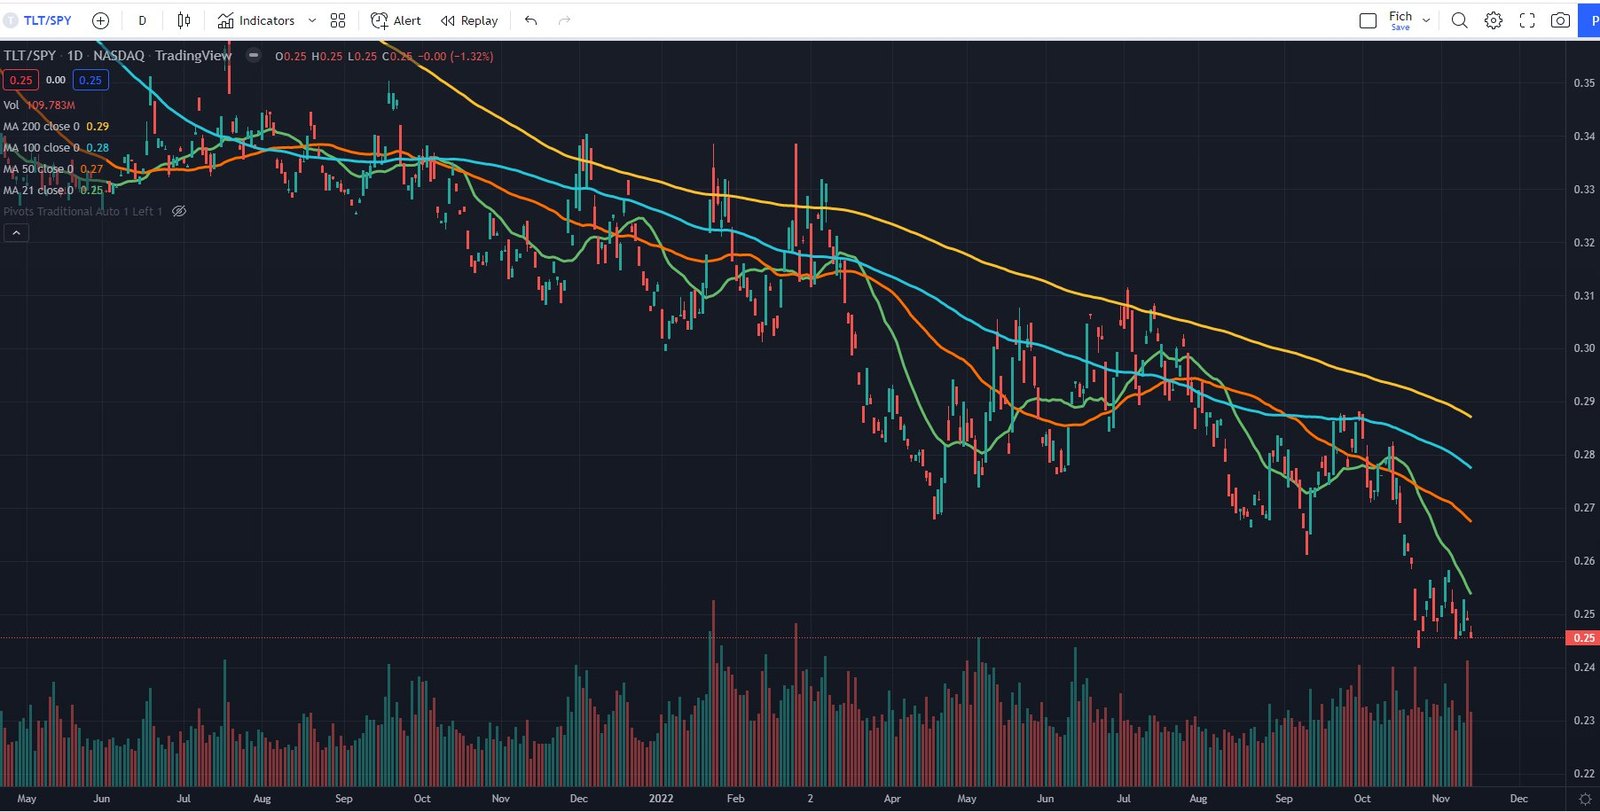
I think the moves on Thursday and Friday happened too quick. Both the equity and bond markets need time to digest the news. I am expecting a little bit of pain this week which I think should eventually resolve and continue the marching higher in the cash market (bond market). I am not so confident about the equity market as I think it is stretched at these levels. However, I wouldn’t go short yet (Prefer the 200d SMA level). I am also aware we may get further short squeeze if economic data keep coming lower than expected (further boosting the expectations of rates cuts) Hopefully credit will be strong into year end, which is my expectation. If we keep getting weaker than expected data, I would position myself long TLT (ZB_F) short SPY(SPX or ES_F). A view that the US will be entering recession. In a recession, equities will be weak, bonds bid due to inherent expectations of rate cuts. The current level on the ratio chart of TLT/SPY is at a great level.
This is OFM Capital’s own research, published for information only. It is not investment advice or an offer of any kind. We may hold positions in the securities mentioned.